- Shankhya Debnath
- HoD & Lecturer, Dept. of Printing Technology
- Regional Institute of Printing Technology
- shankhya@wbscte.ac.in
- 03324146432 (O)

Musings
I am deeply interested in the field of color science, colorimetry and color management. However, I am not a coder and the codes that I have used to solve problems I find interesting, may reflect my deficiency of coding skill. As a novice and a learner in the field of color science, I think however, that the topics I have written about and the codes I have created may work as a starting point for someone like me how shares the same passion and interest in the domain. Albeit some problems and solutions I have talked about here may seem trivial, but I feel that for understanding any field, one must have a very strong understanding of the basics. I am a firm believer of open science and free and open source software. As a learner, I feel that knowledge can not be bound and kept behind paywalls. And so I have given all my source code with each post made in this page. I am hopeful that someone who shares my passion and philosophy may find some value in what I have shared.
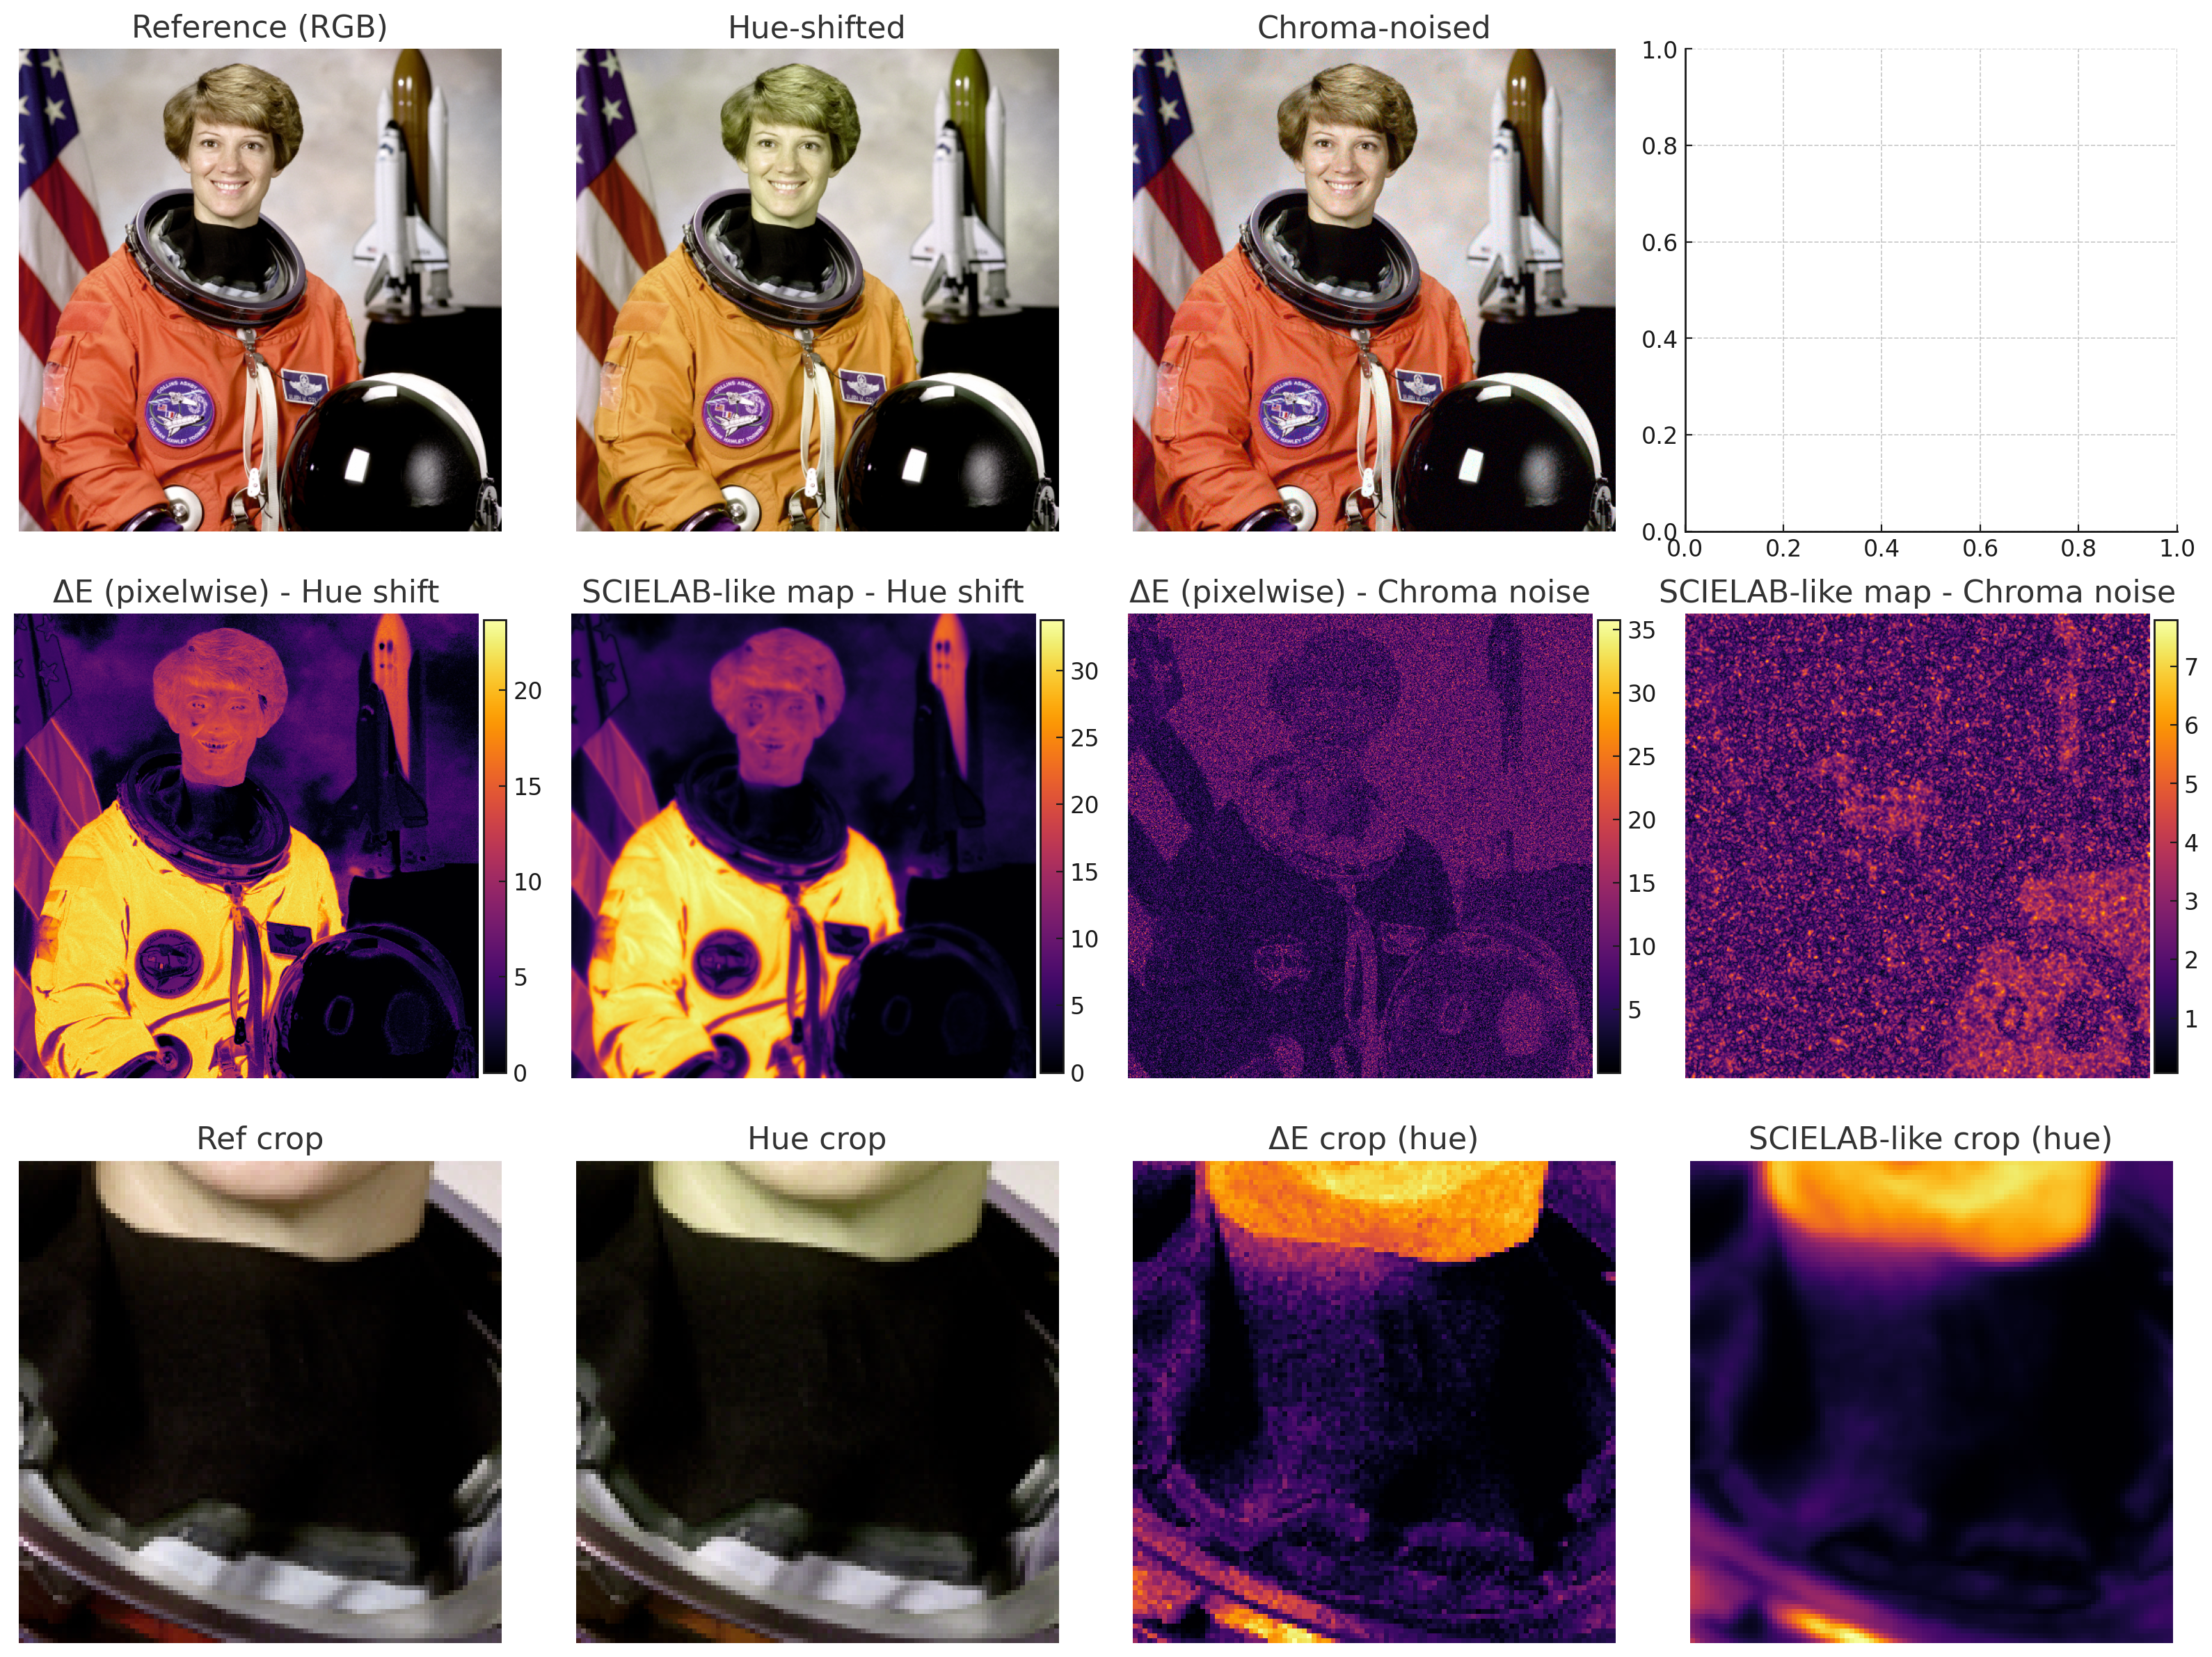
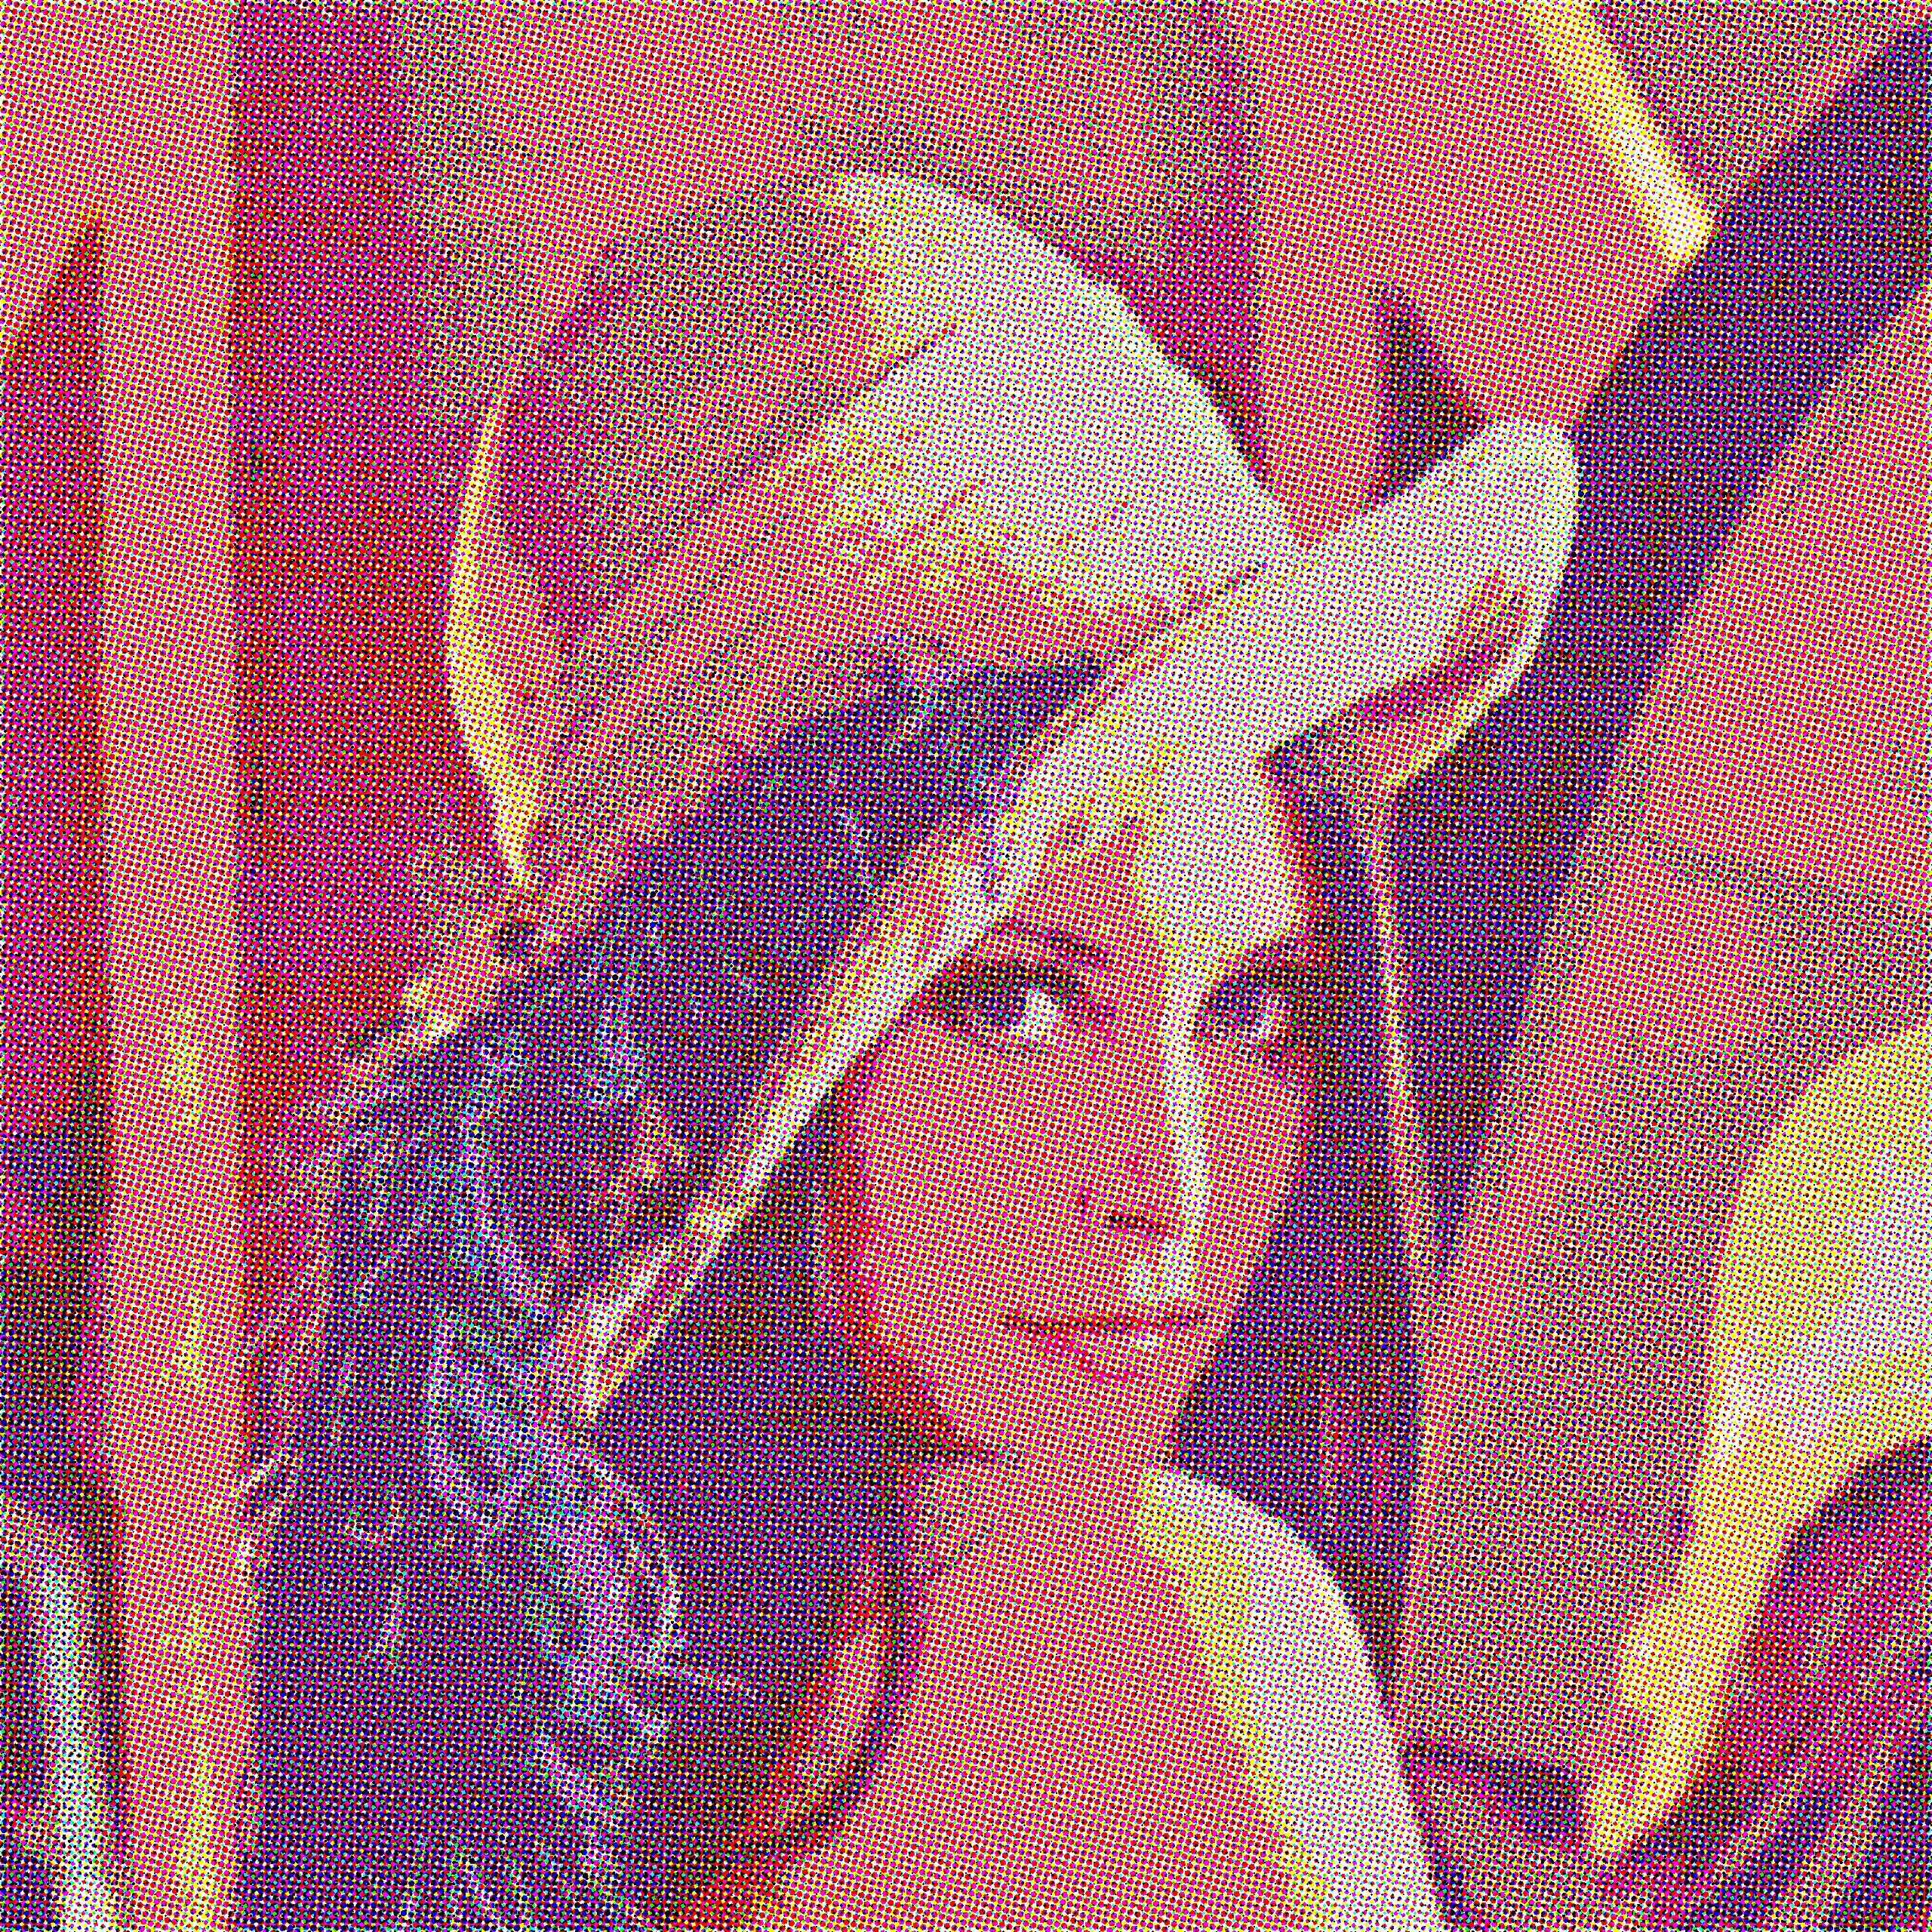
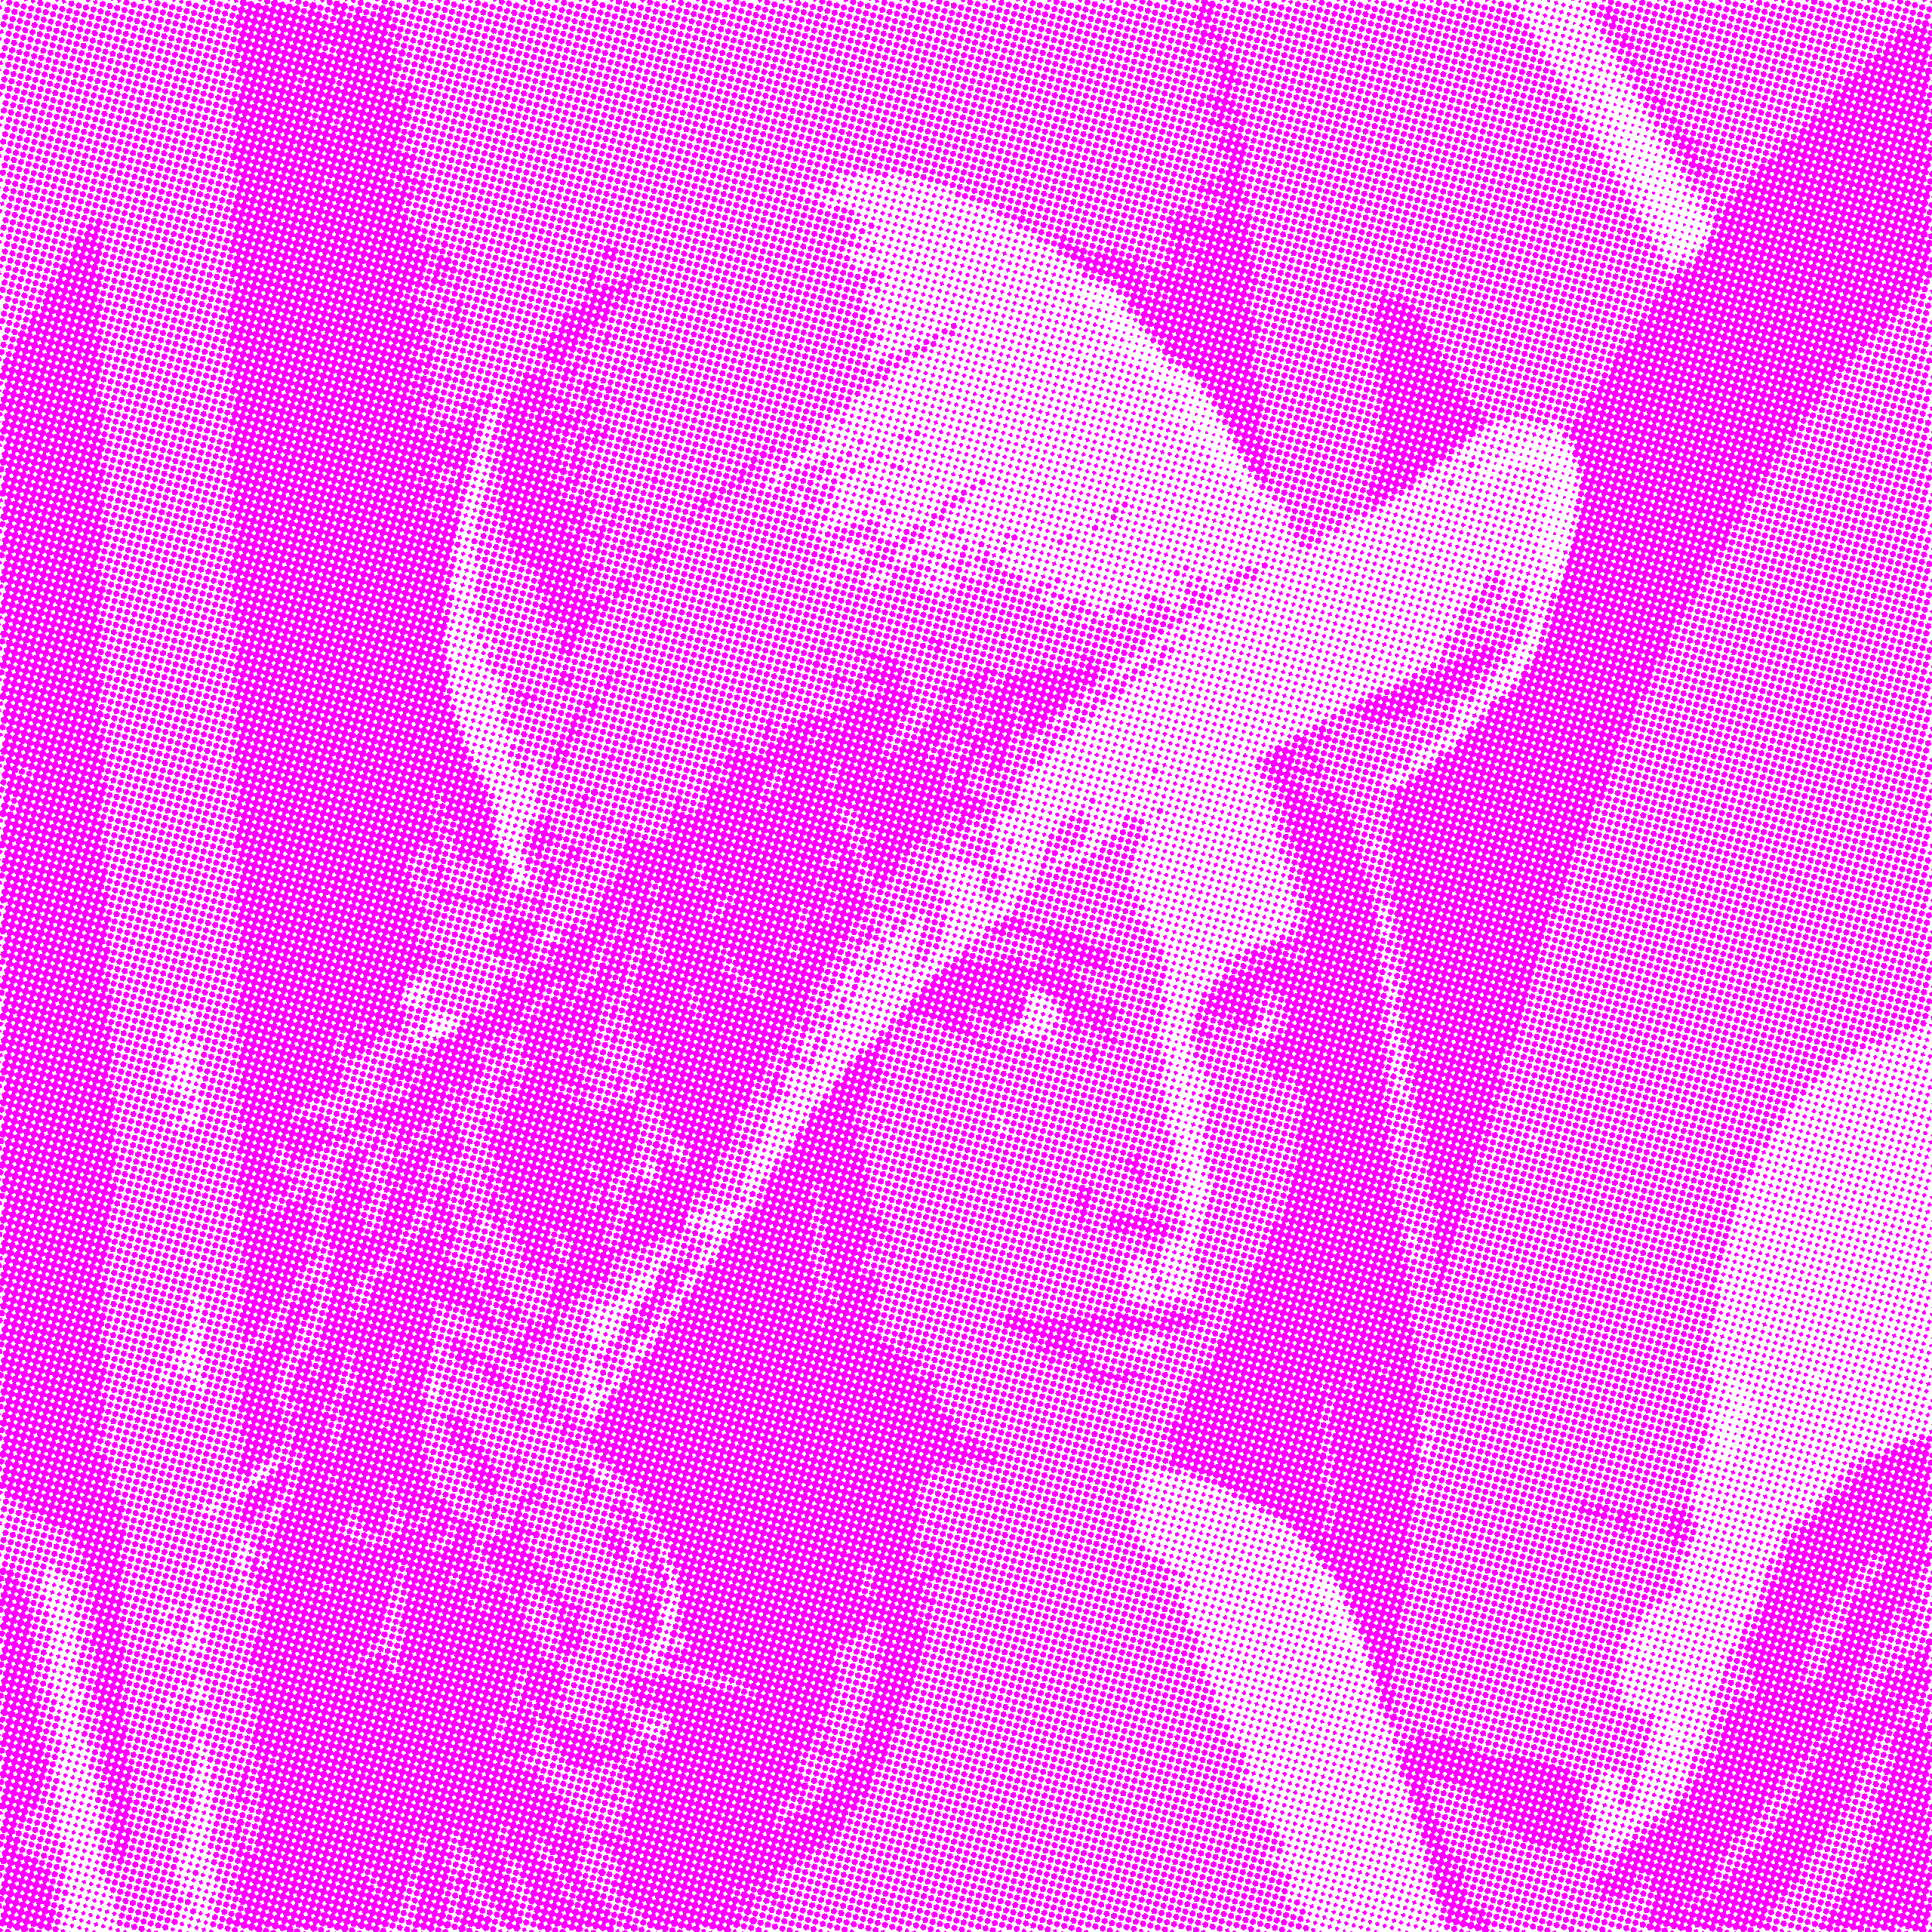
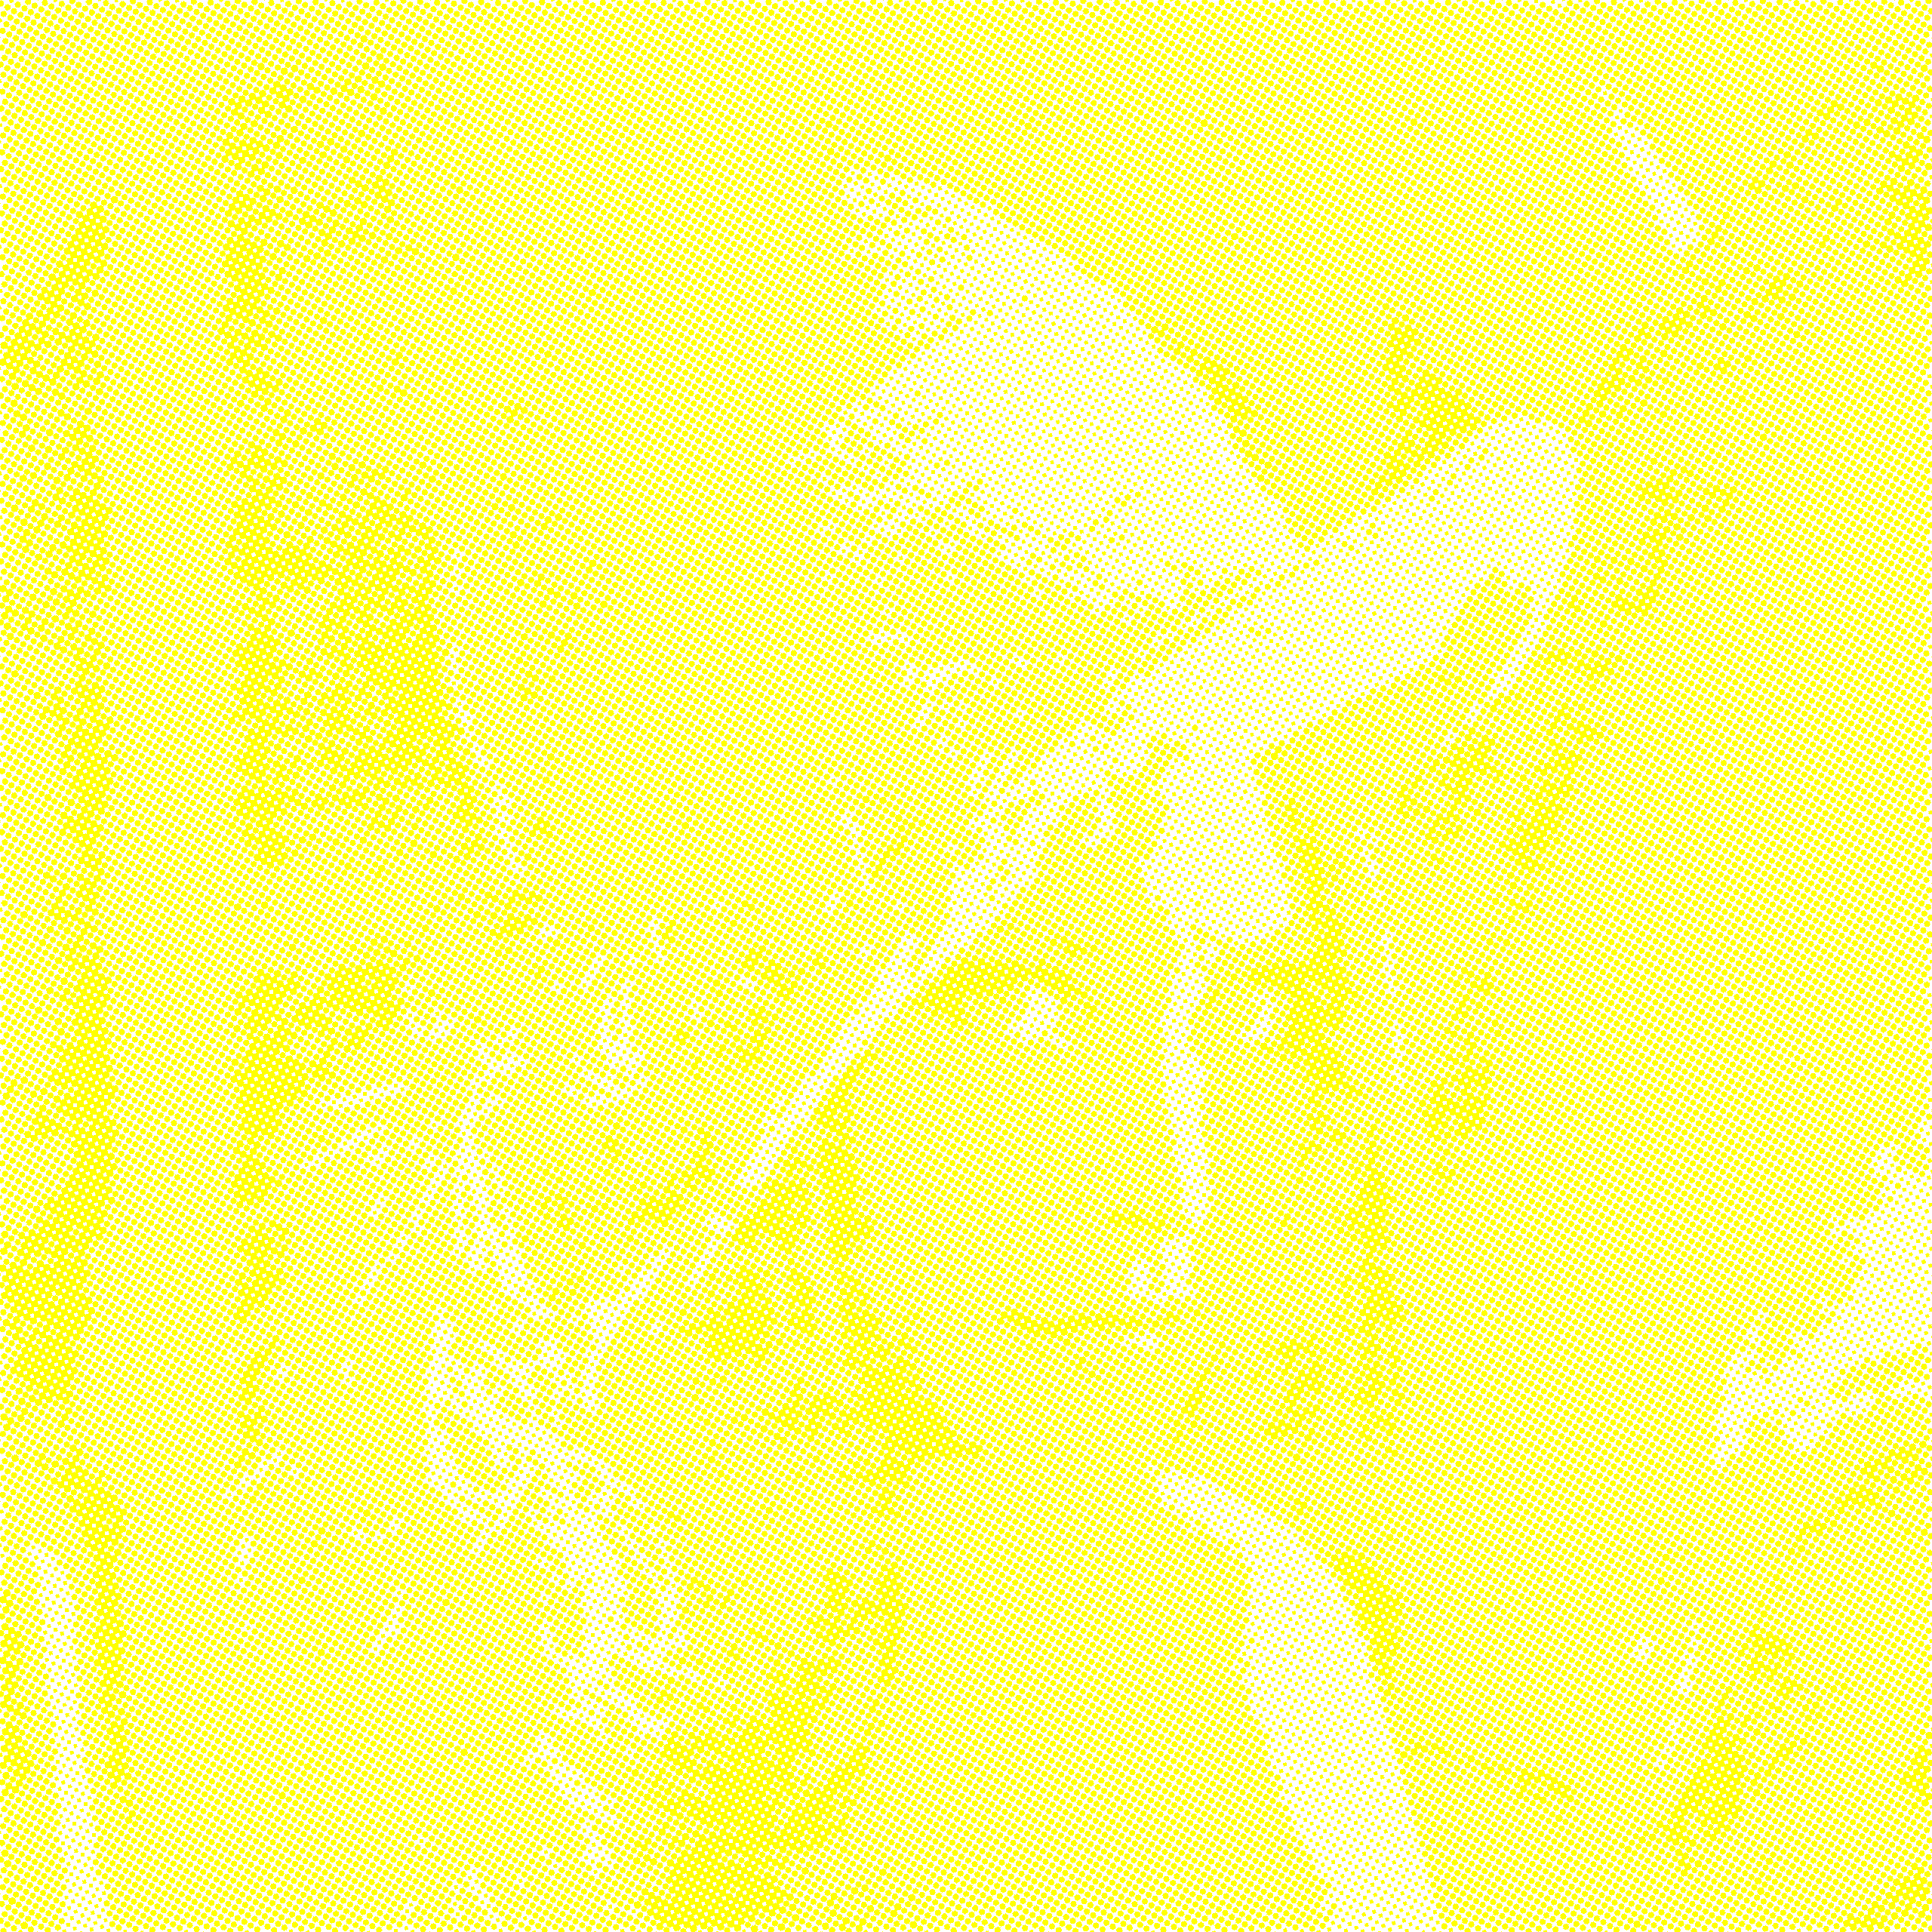
16.08.2025: SCIELAB Local Color-Difference Demo
The presented method describes a SCIELAB-inspired local color-difference demonstration. The goal is to combine color-difference metrics (e.g., CIEDE2000 or Euclidean CIELAB) with a multi-scale spatial integration to better approximate perceived differences in images. The document includes background theory, a mathematical description of the simplified SCIELAB-like pipeline implemented, results on test distortions, and interpretation of the outcomes. Source code | Mathematical background
16.08.2025: A Simplified iCAM-like Image Appearance Pipeline
This method describes the design, mathematical formulation, implementation, and experimental evaluation of a simplified iCAM-like image appearance pipeline. The pipeline implements the core appearance-preserving ideas from iCAM family models: (1) local adaptation estimation, (2) local tone mapping, and (3) chromatic preservation during luminance remapping. Results and quantitative summaries for example images are presented, followed by discussion on limitations and next steps for a closer reproduction of iCAM.
Source code | Mathematical background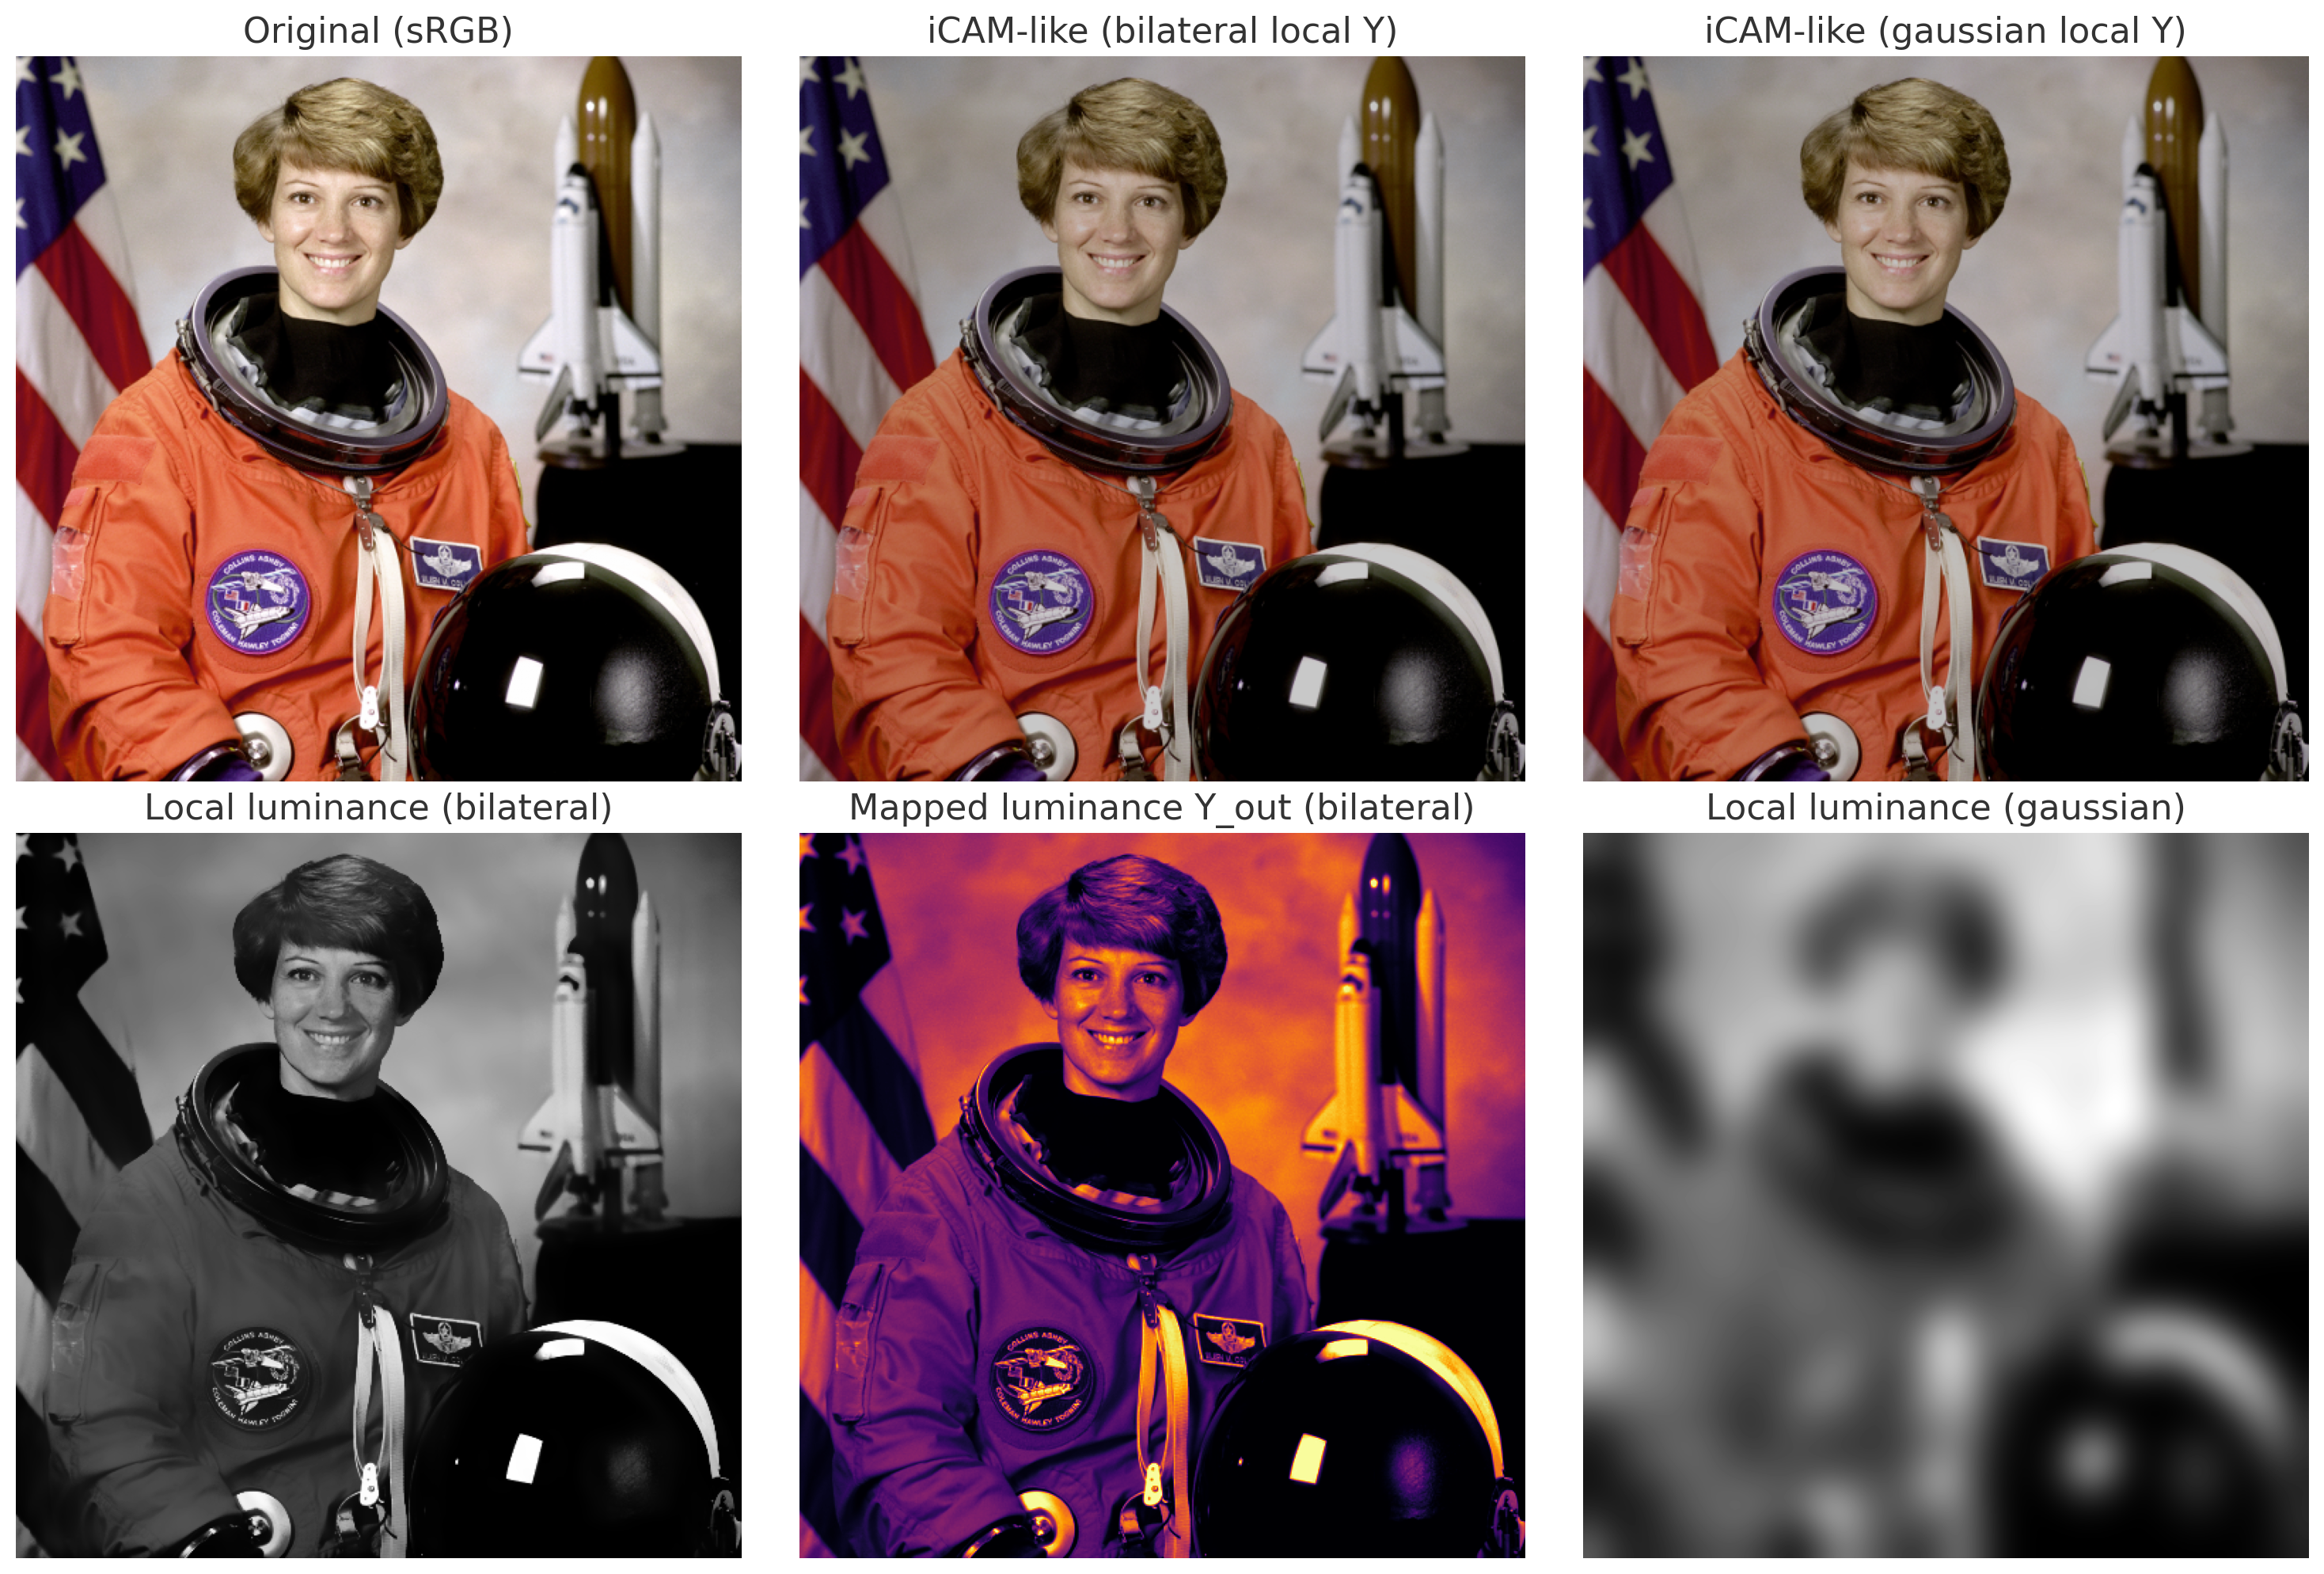
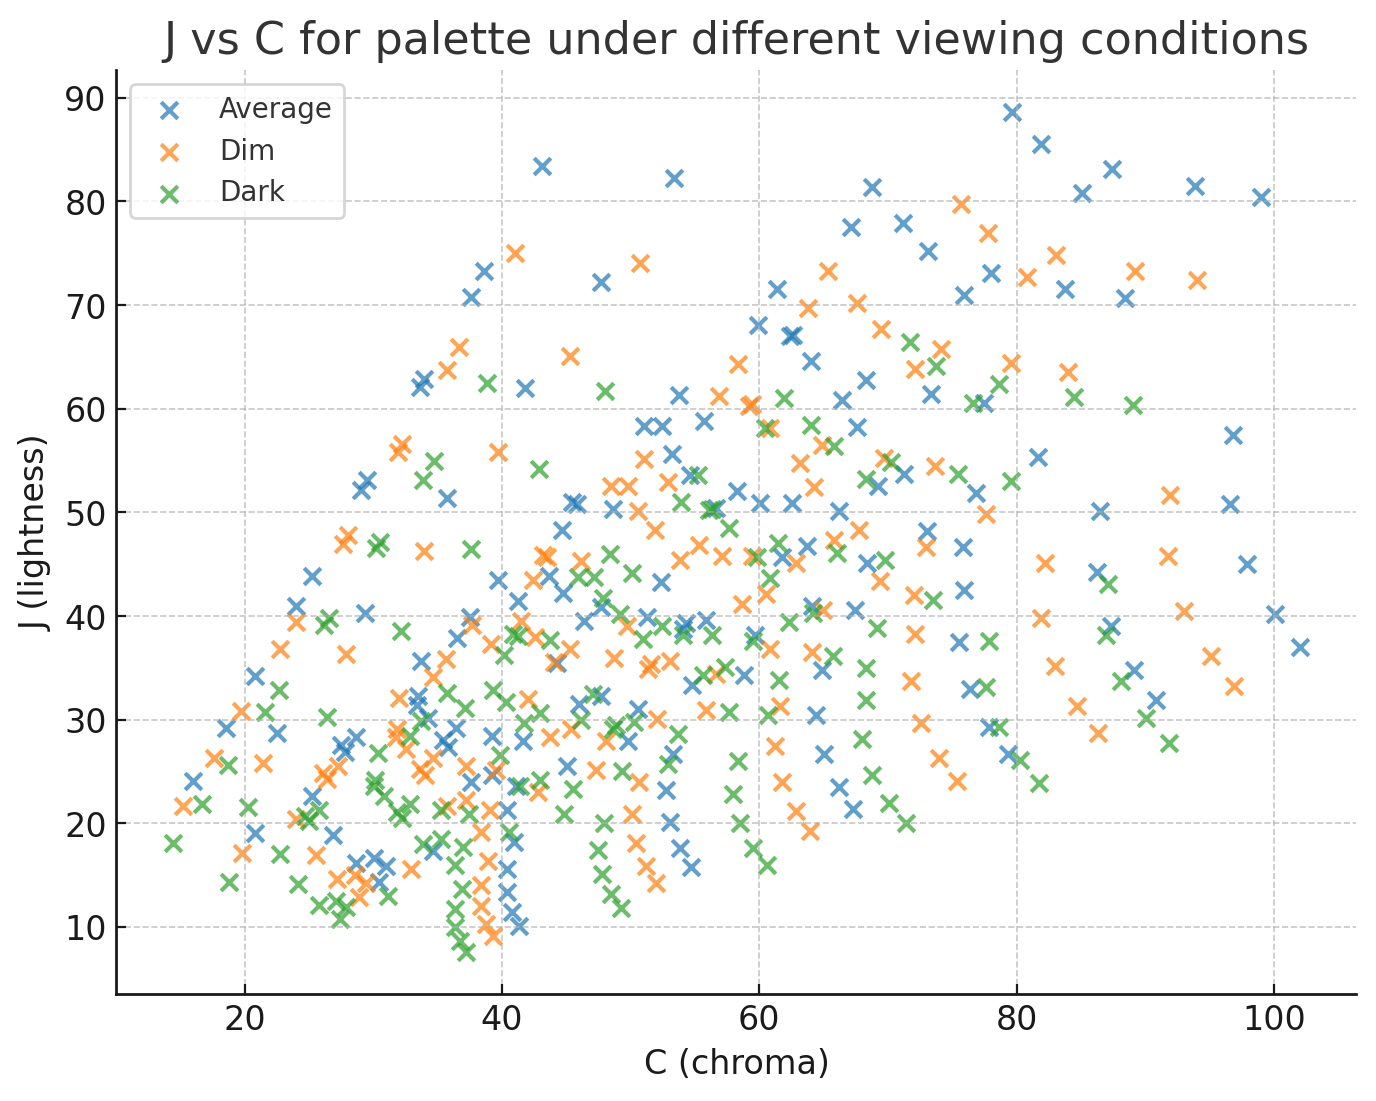
16.08.2025: CIECAM02 Implementation and Visualization
This method presents a basic implementation of the CIECAM02 color appearance model and a visualization study showing how a palette of colors behaves under different viewing conditions. The document contains necessary background, detailed mathematical descriptions of the model components used in the implementation, implementation notes, the visual results produced by the demo, and interpretations and inferences drawn from those results.
Source code | Mathematical background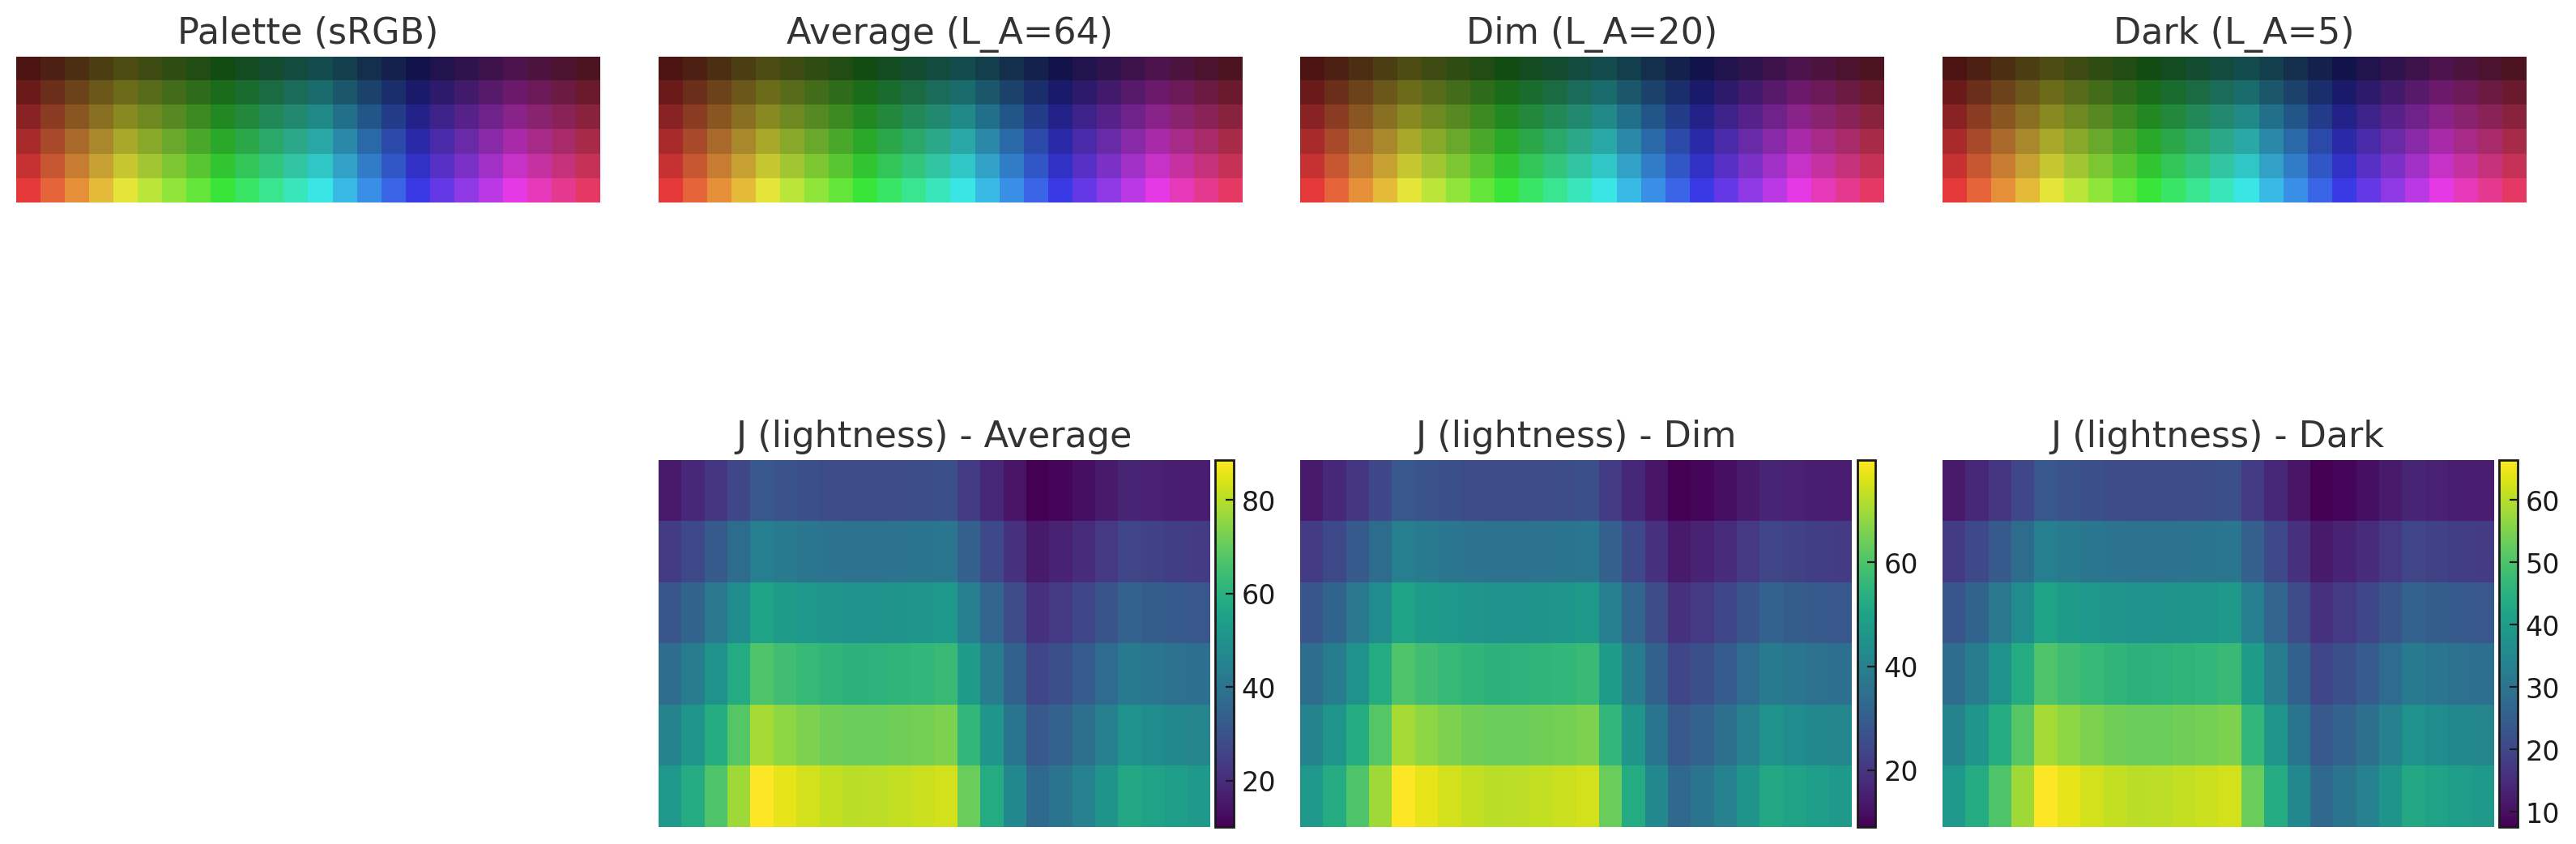
06.10.2024: Methods for Printer Calibration and Characterization
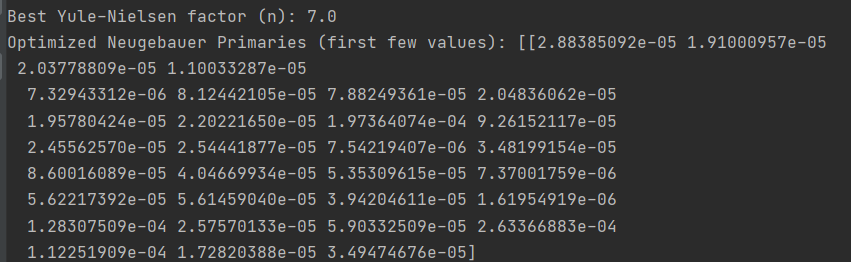
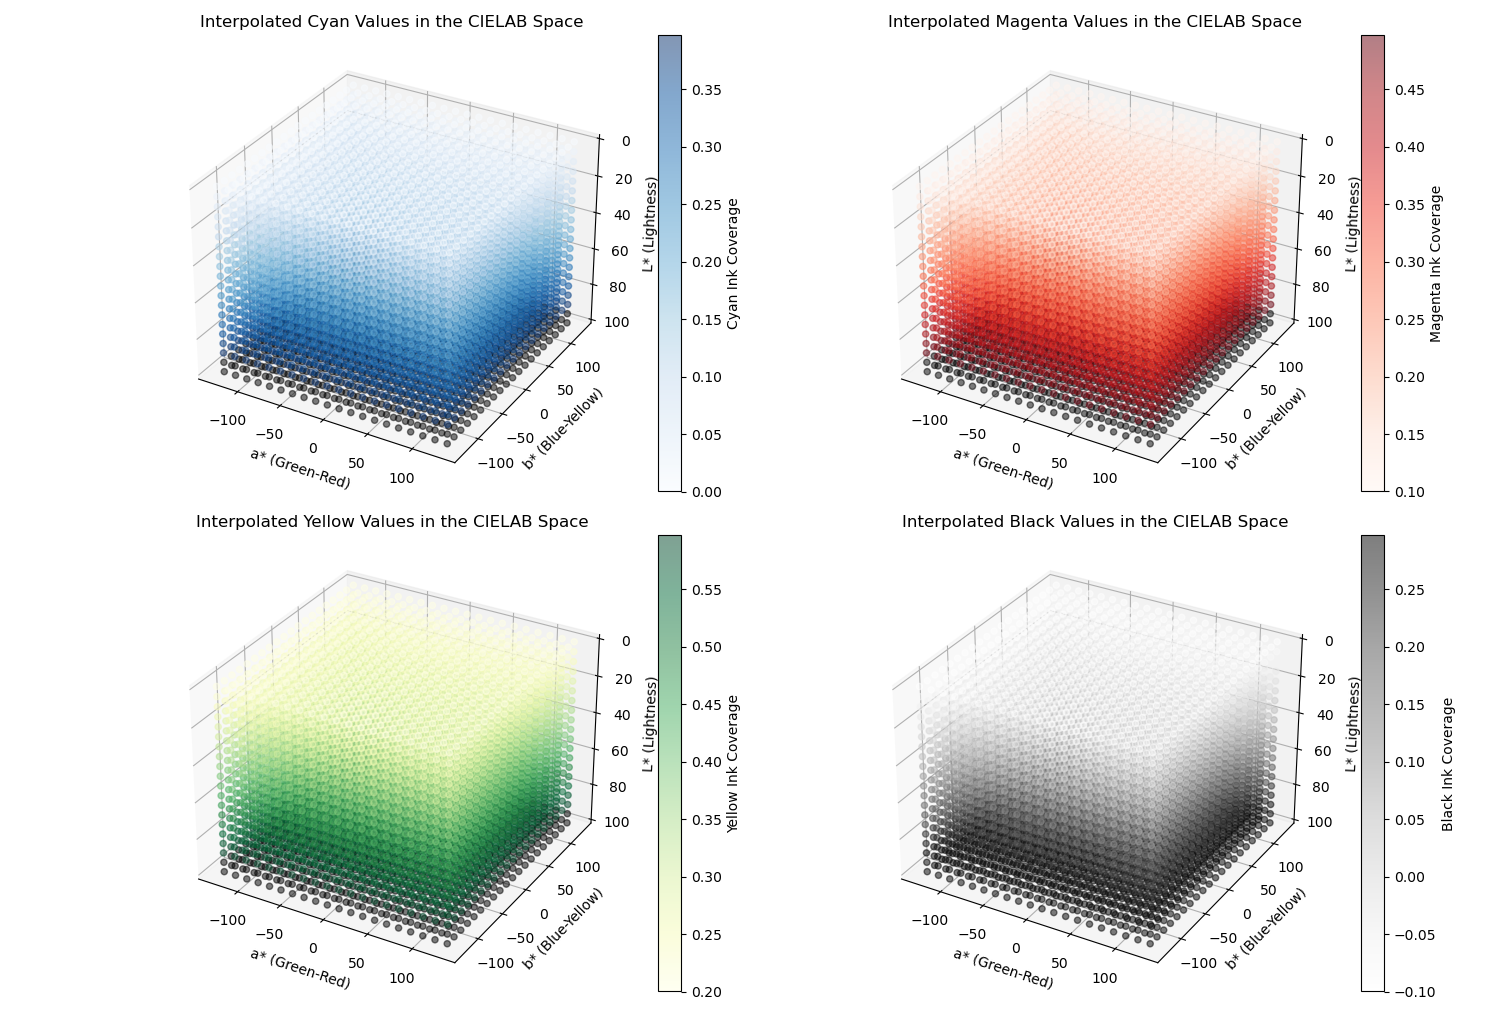
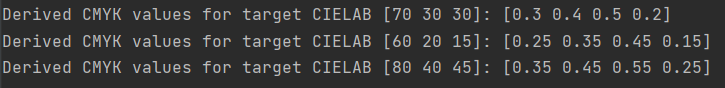
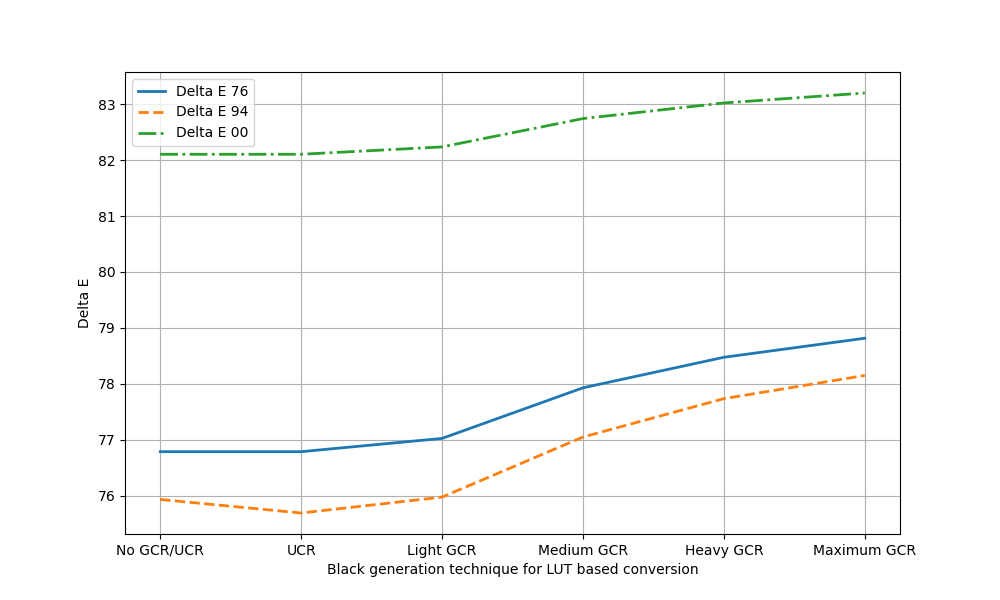
Methods for Channel-Independent Calibration, Cellular N-Model, Forward Characterization, and Inverse Characterization are presented. The Channel-Independent Calibration focuses on calibrating each color channel independently by calculating and scaling color differences. The Cellular N-Model addresses the interaction between colorants through trilinear interpolation and regression to optimize Neugebauer primaries. Forward Characterization predicts color appearance based on CMYK input values, while Inverse Characterization inverts this process to find CMYK values that achieve specific colorimetric targets.
Channel Independent Calibration | Cellular Neugebauer based Characterization | Empirical based Forward Characterization | Empirical based Inverse Characterization | Explanation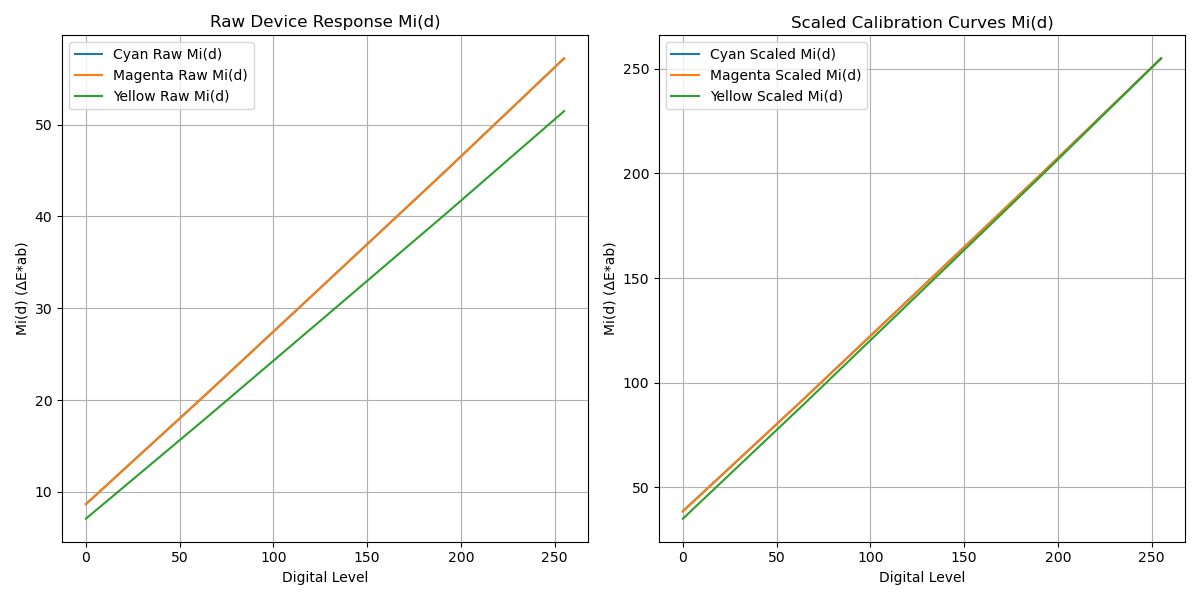
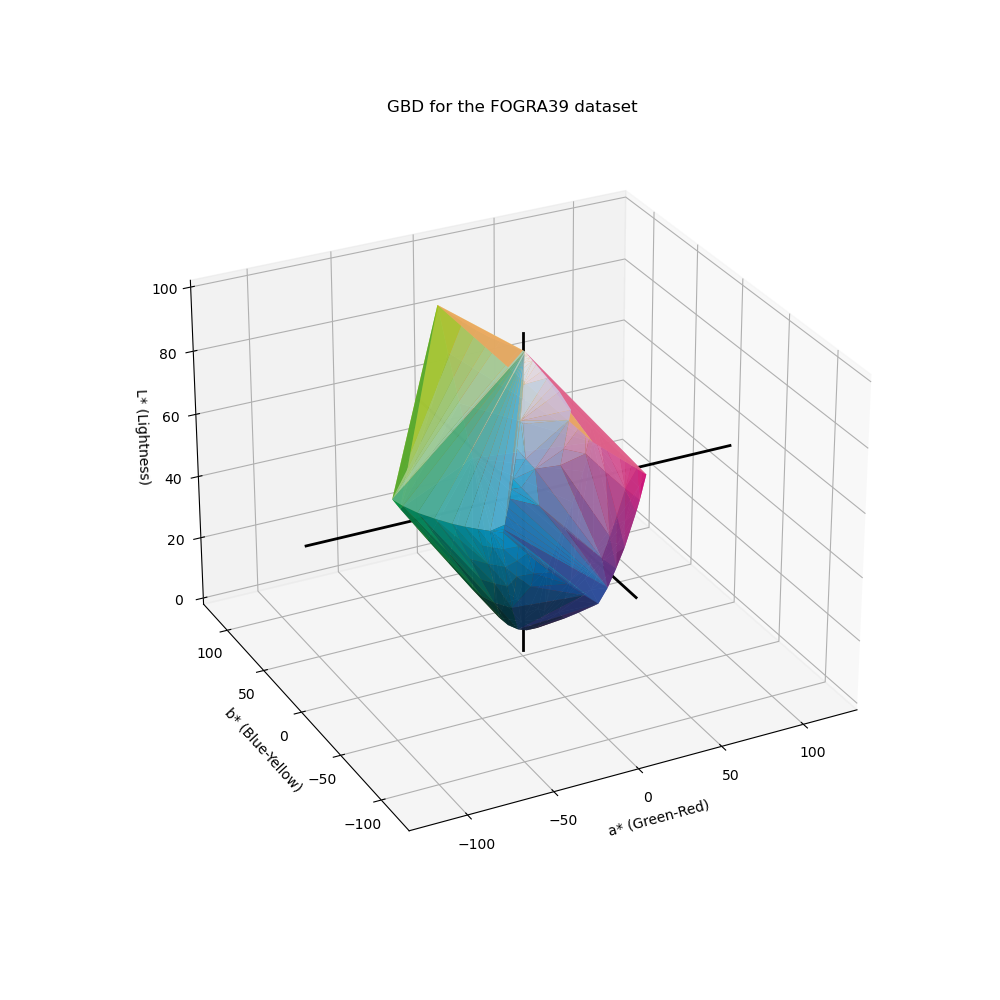
20.09.2024: Implementing modified convex hull for GBD computation
The presented method calculates and visualizes the Gamut Boundary Descriptor (GBD) in LAB color space using a modified convex hull approach adapted from Bala et. al. It first converts the input image to LAB space, then applies a pre-conditioning transformation to adjust the distance of each point from a reference point (typically [50, 0, 0]). The LAB space is segmented into bins based on spherical coordinates, and the point with the maximum radial distance in each bin is selected as the segment maxima. After applying a convex hull to these maxima points, an inverse transformation returns the points to LAB space, and the resulting 3D surface is visualized. The granularity of the convex hull and size of the triangles can be adjusted by increasing the segmentation bins, making the surface more detailed and precise.
Source code | Mathematical background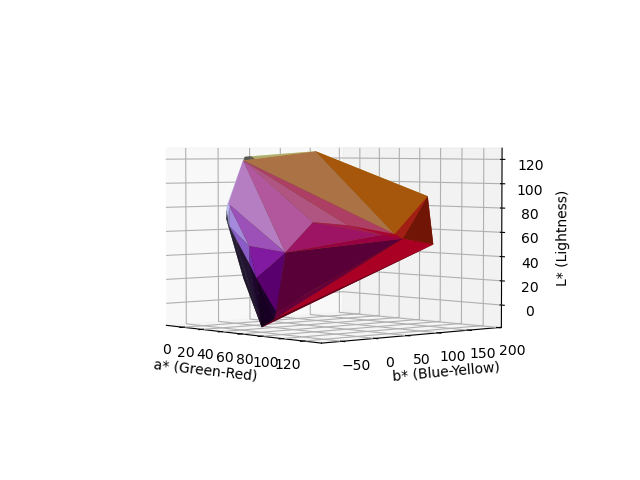
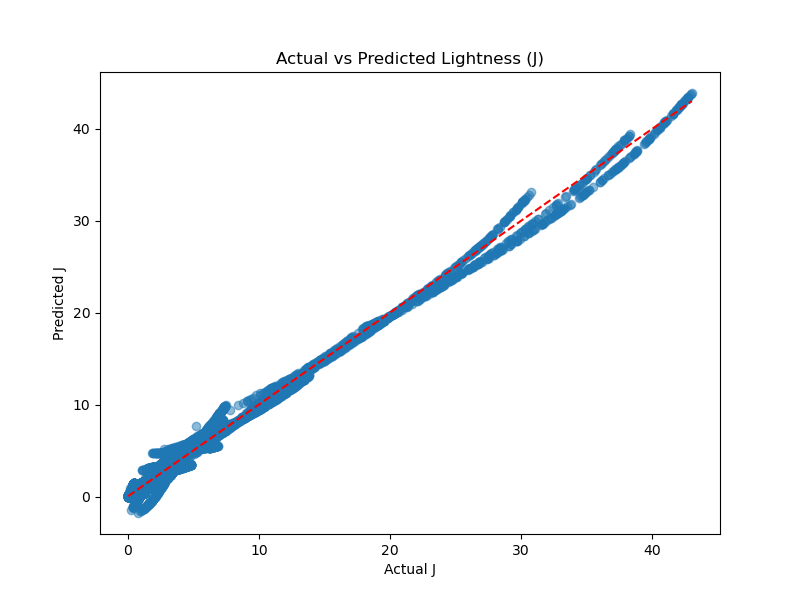
18.09.2024: Predicting Perceptual Attributes Using Neural Networks
A method is proposed to predict perceptual color attributes (such as lightness, chroma, hue, etc.) based on spectral reflectance data of color patches under various viewing conditions using a neural network. A neural network is trained using the Munsell color patches under different illuminants, luminance levels, and background conditions. The CIECAM02 color appearance model is employed to simulate how these color patches would appear under specific viewing conditions.
Source code | Mathematical background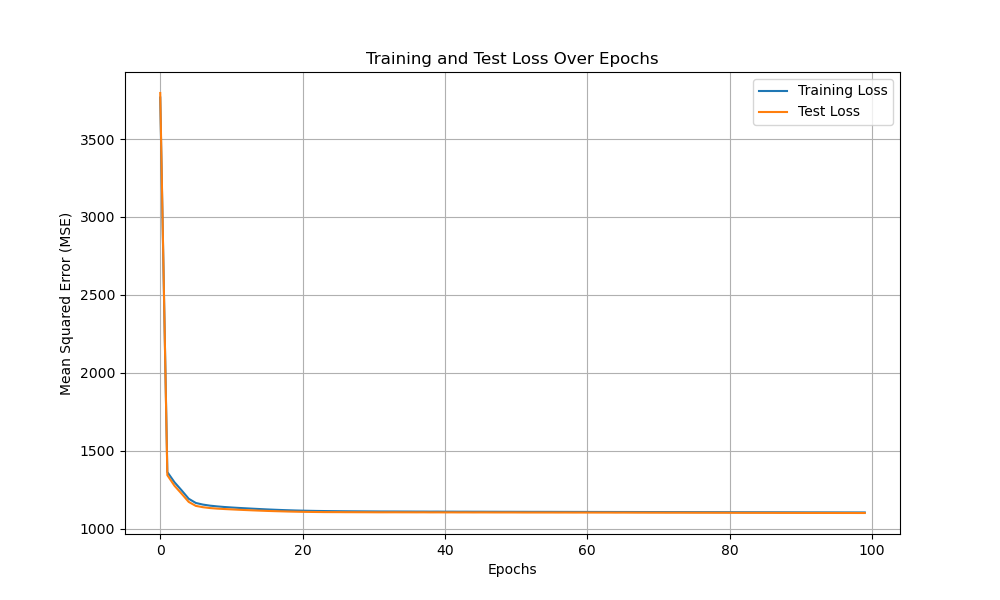
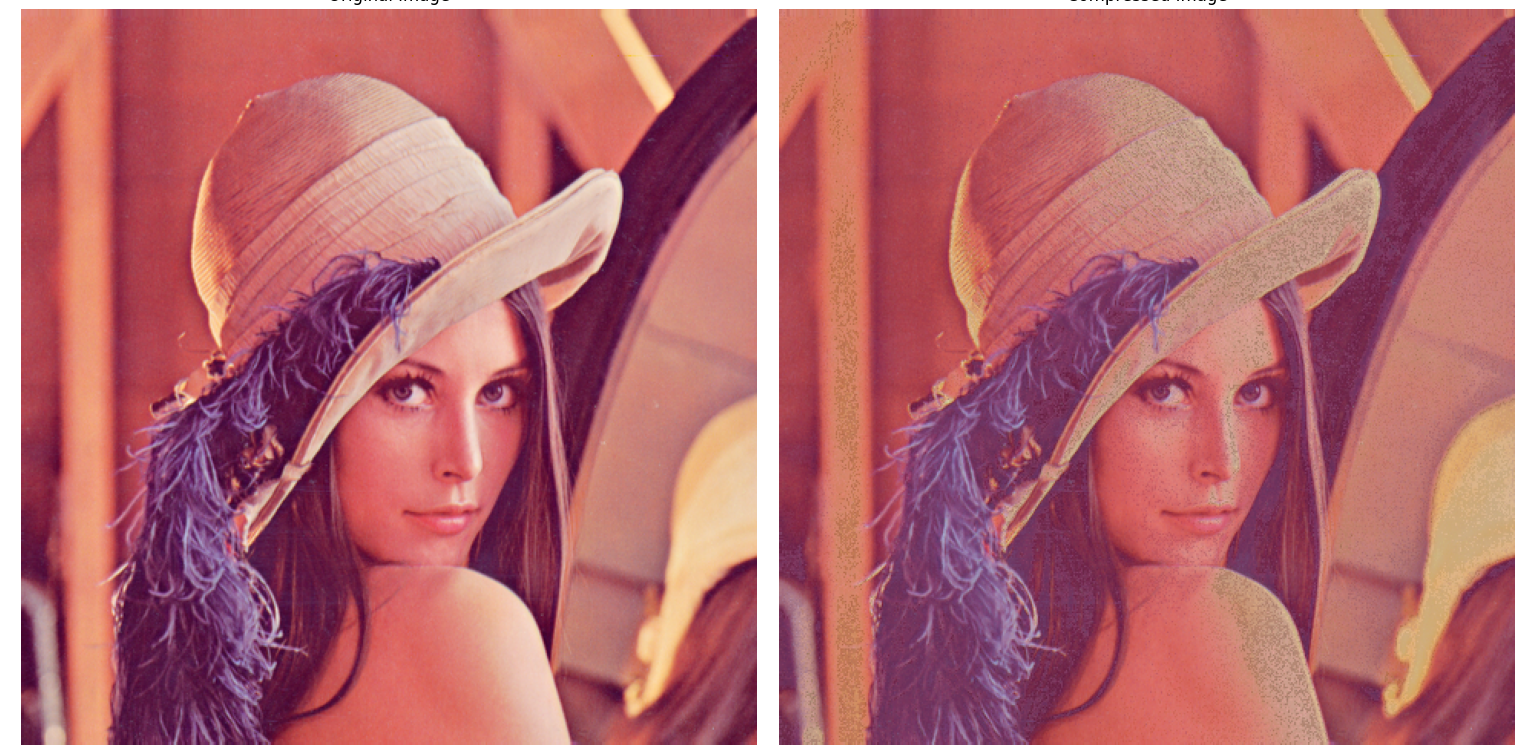
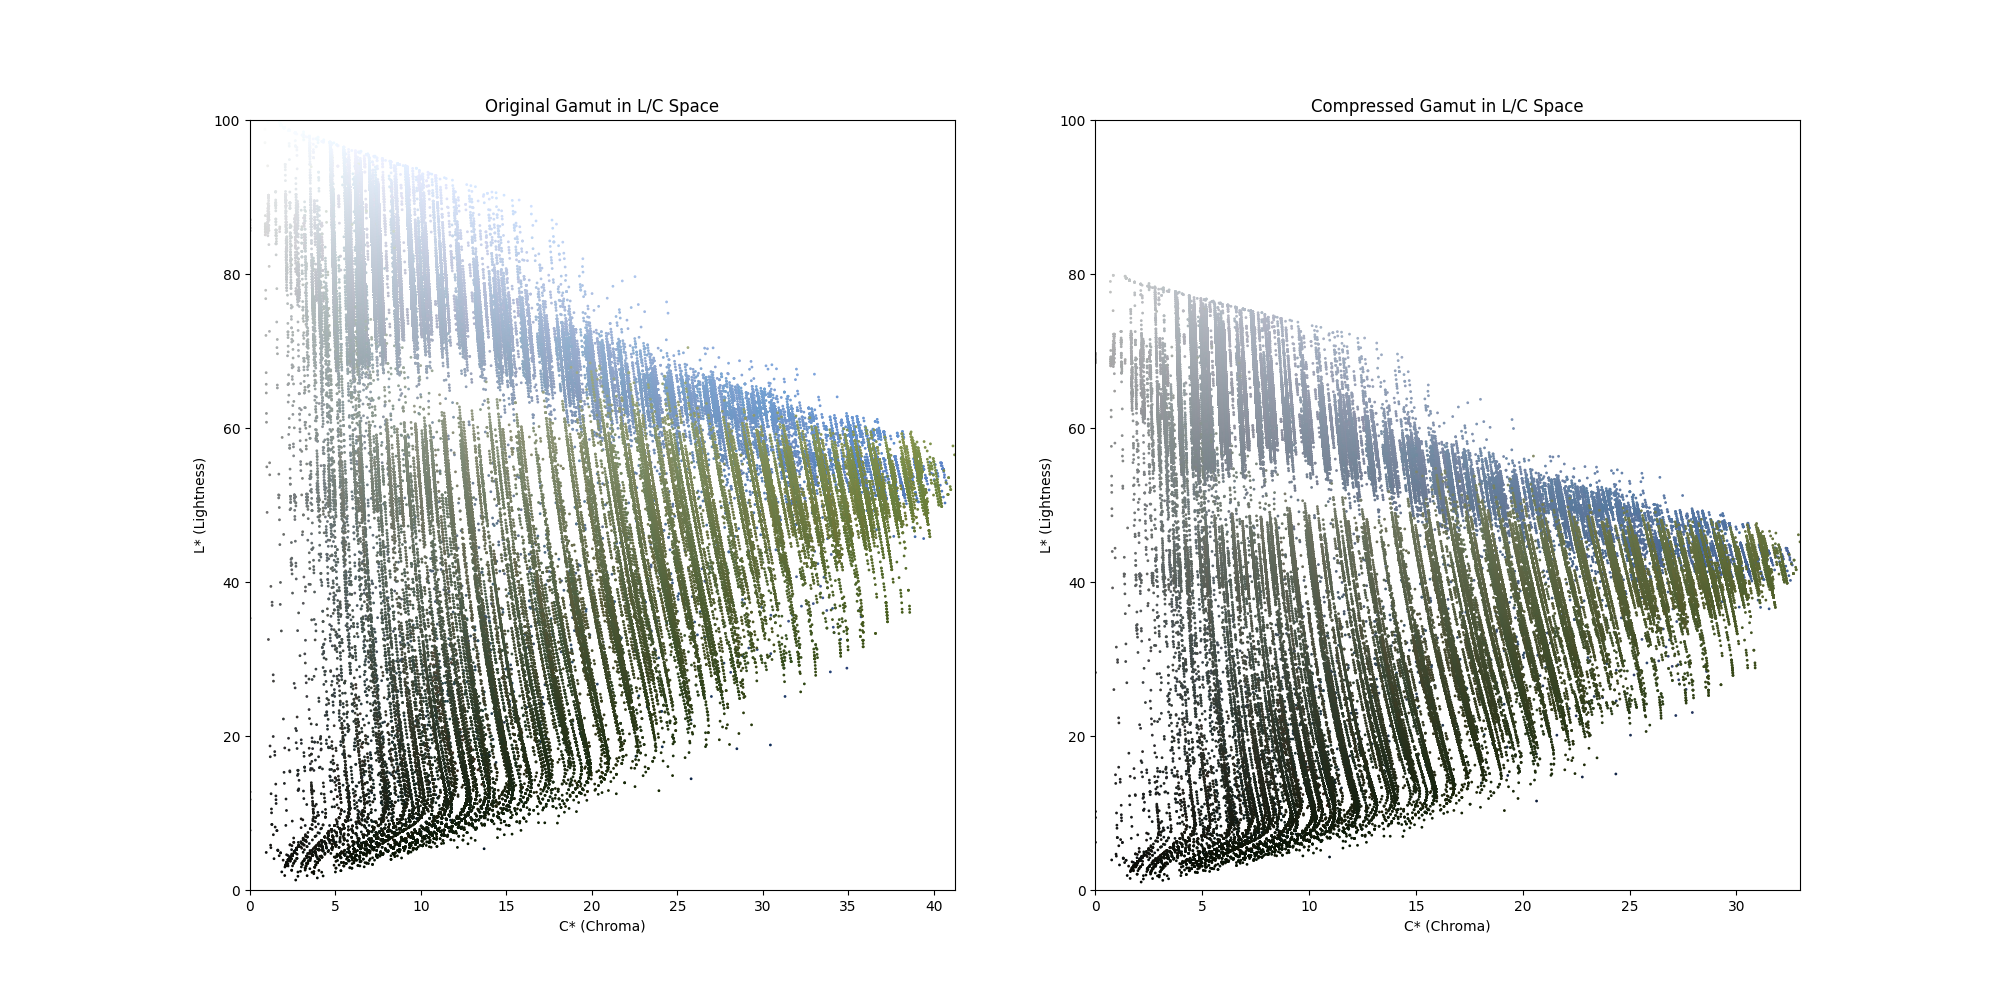
14.09.2024: A sigmoidal gamut compression algorithm
The presented method performs a gamut compression process on an image. It calculates the chroma and lightness boundaries of the CMYK printer gamut and then applies a sigmoidal compression to the image's chroma and lightness values. This ensures that all colors fit within the CMYK printer gamut, preventing out-of-gamut colors. The compressed image is then reconstructed and displayed side-by-side with the original. Additionally, convex hulls of the original, compressed, and CMYK gamuts are plotted in 3D to visualize the color space reduction, with the compressed gamut fitting entirely within the CMYK gamut. The volumes of each gamut are also calculated to quantify the reduction in color space. A Delta E 2000 of 3.93 is obtained between original and gamut compressed images.
Source code | Mathematical background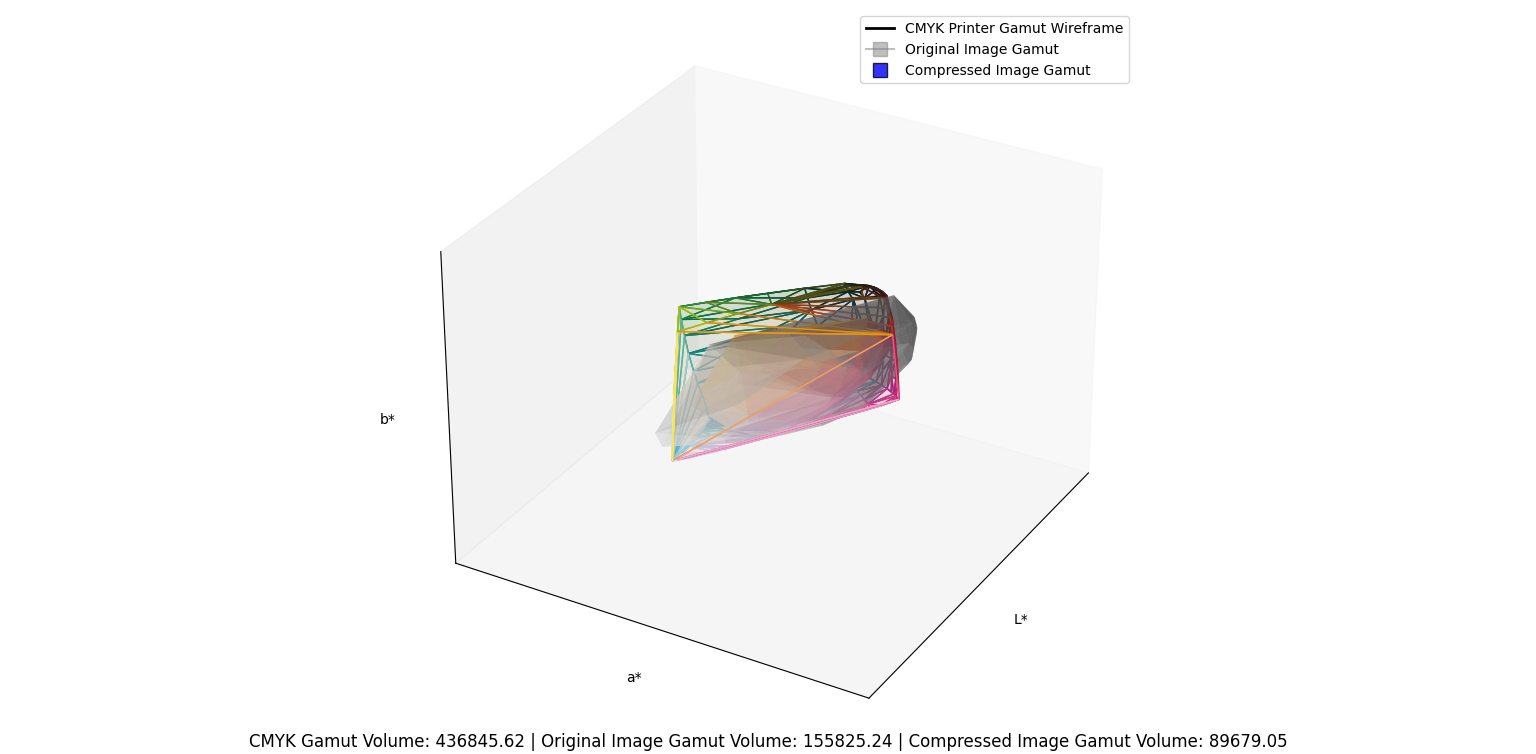
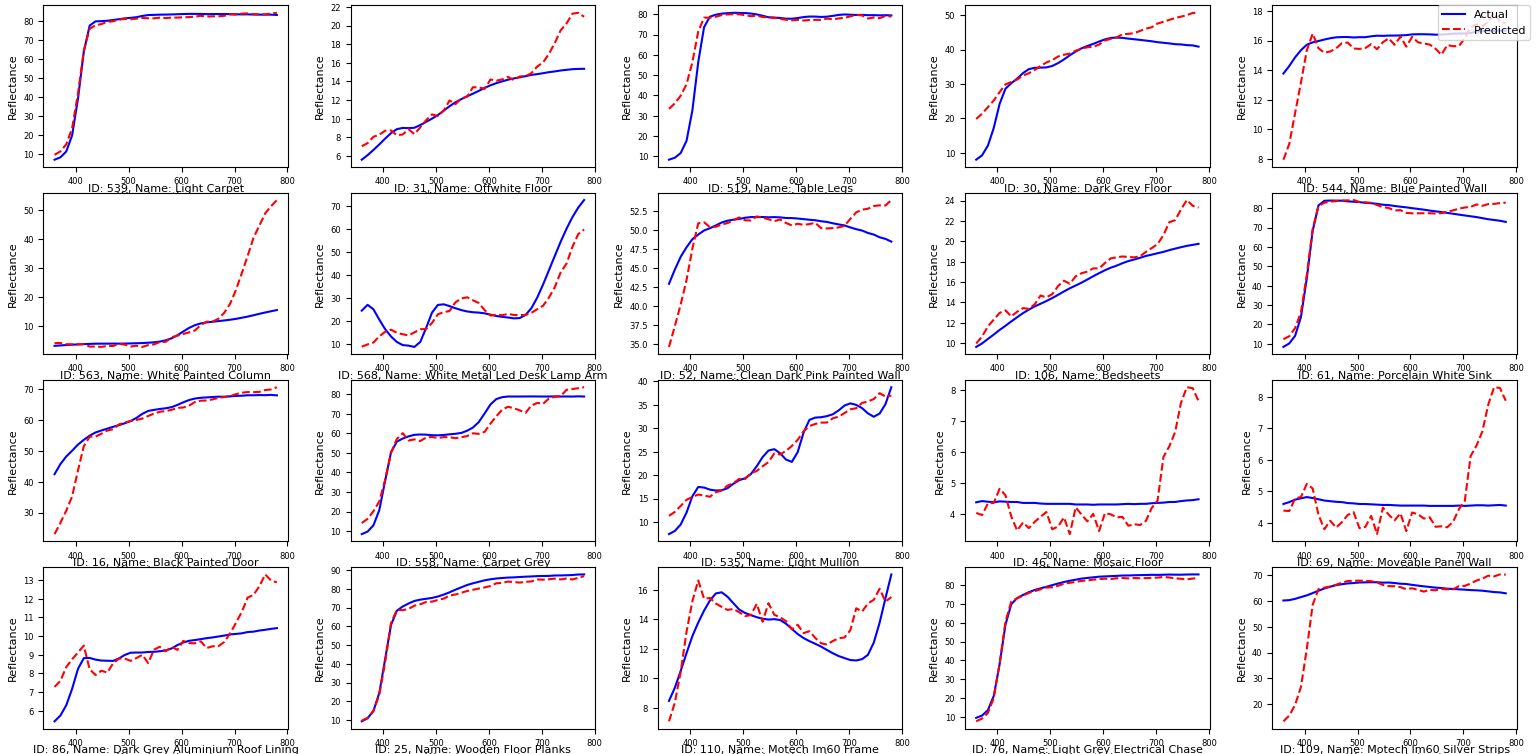
13.09.2024: Spectral Reconstruction from LAB Data Using Neural Networks
A method that implements a machine learning model using a neural network to perform spectral reconstruction from LAB color values has been presented. It processes a dataset of color samples by first cleaning and filtering the data, then extracting spectral reflectance values for 39 wavelengths. The neural network consists of an input layer for the LAB values, followed by three hidden layers with ReLU activation, and an output layer that predicts the spectral values. The LAB inputs and spectral outputs are standardized for efficient training. The model is compiled using the Adam optimizer and the mean squared error (MSE) loss function. After training the model on the data, its performance is evaluated using metrics like MSE, MAPE, and R². The trained model is then used to predict spectral reflectance for new samples, with the actual and predicted spectra plotted for comparison. Results indicate that further investigation is required to ensure generalization of the model and prevent overfitting.
Source code | Mathematical background
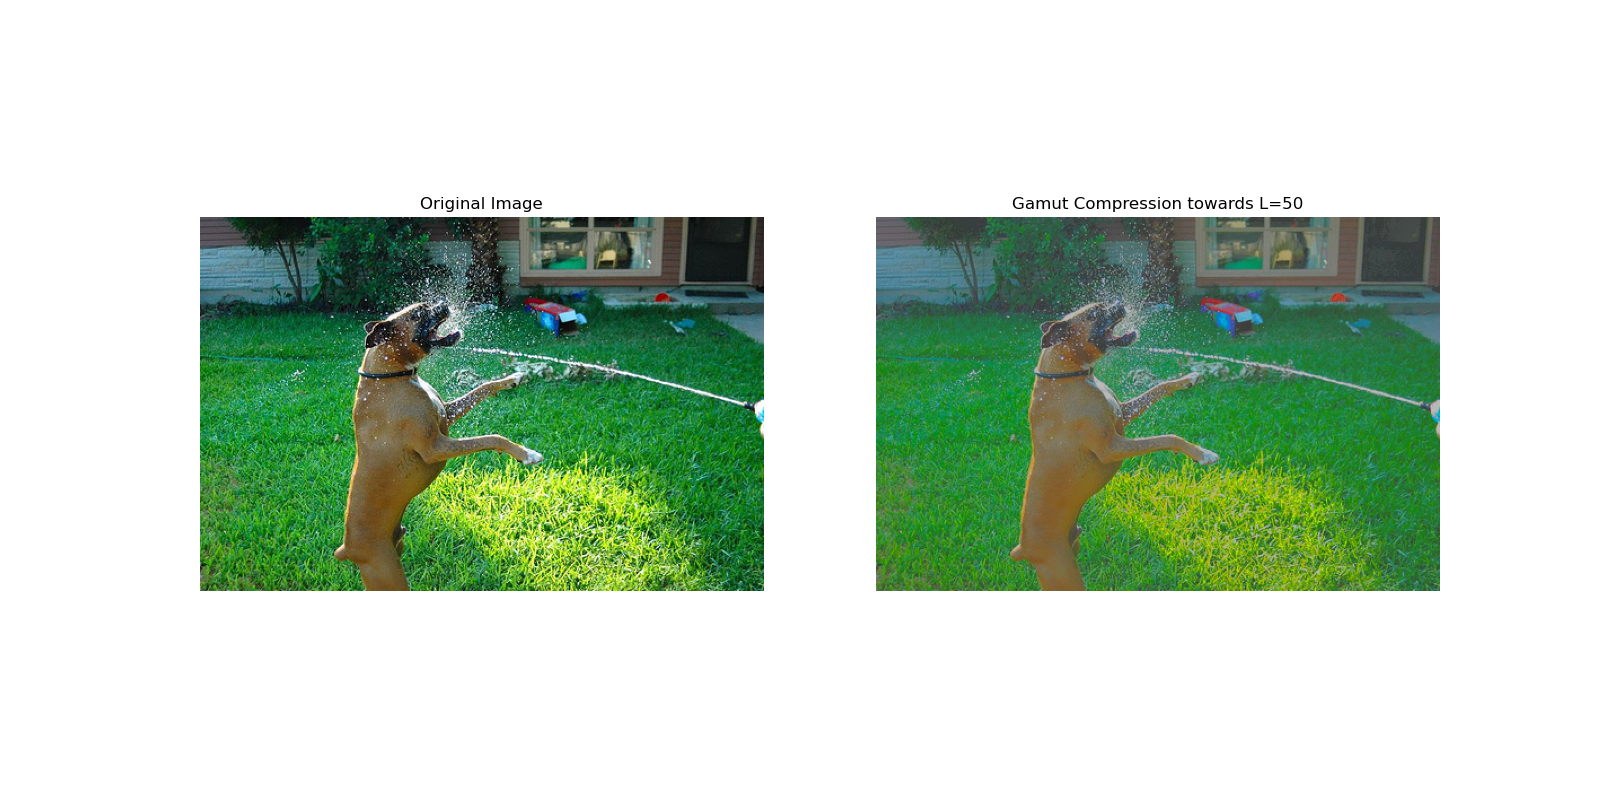
10.09.2024: A method for Gamut Compression towards L=50
This method involves compressing an image's RGB gamut to fit within the smaller CMYK device gamut. Out-of-gamut colors in the RGB space are compressed by mapping them to the nearest boundary point of the CMYK gamut, while in-gamut colors are proportionally compressed towards a target lightness value of 𝐿∗=50. This ensures that all colors fit within the CMYK space while preserving the image’s overall lightness and reducing chroma. A DeltaE2000 of 6.1366 is obtained between original and gamut compressed images.
Source code | Mathematical background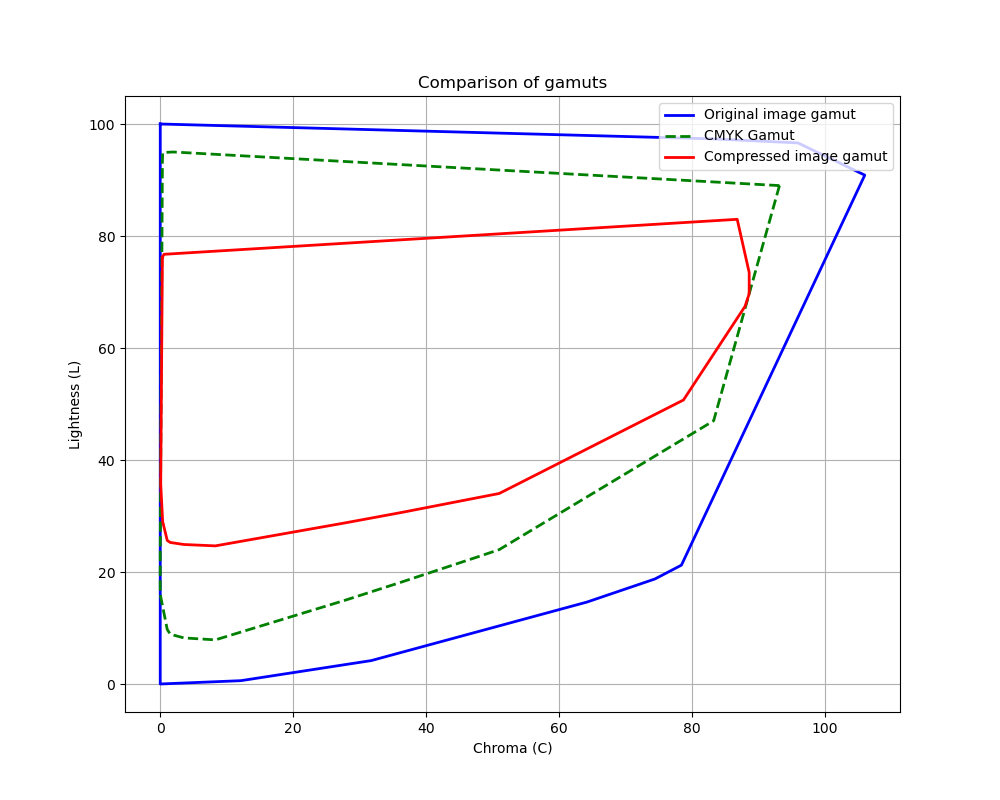
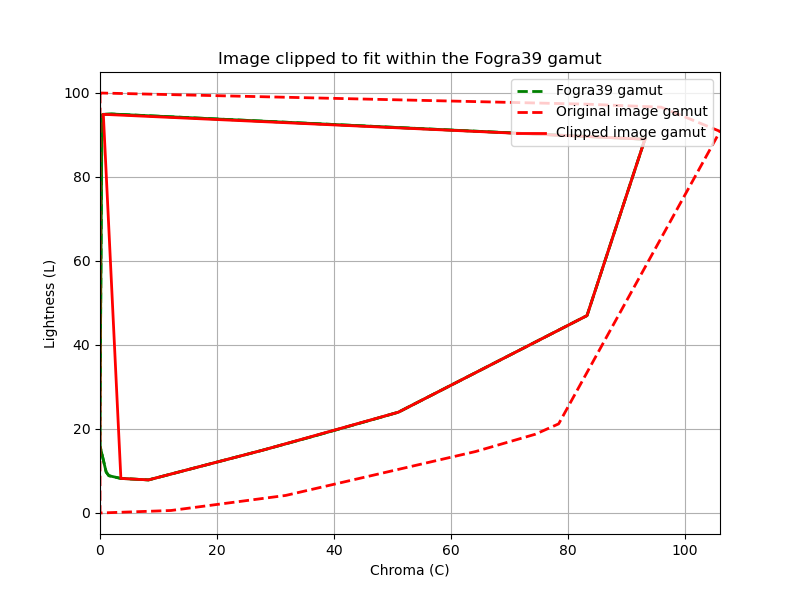
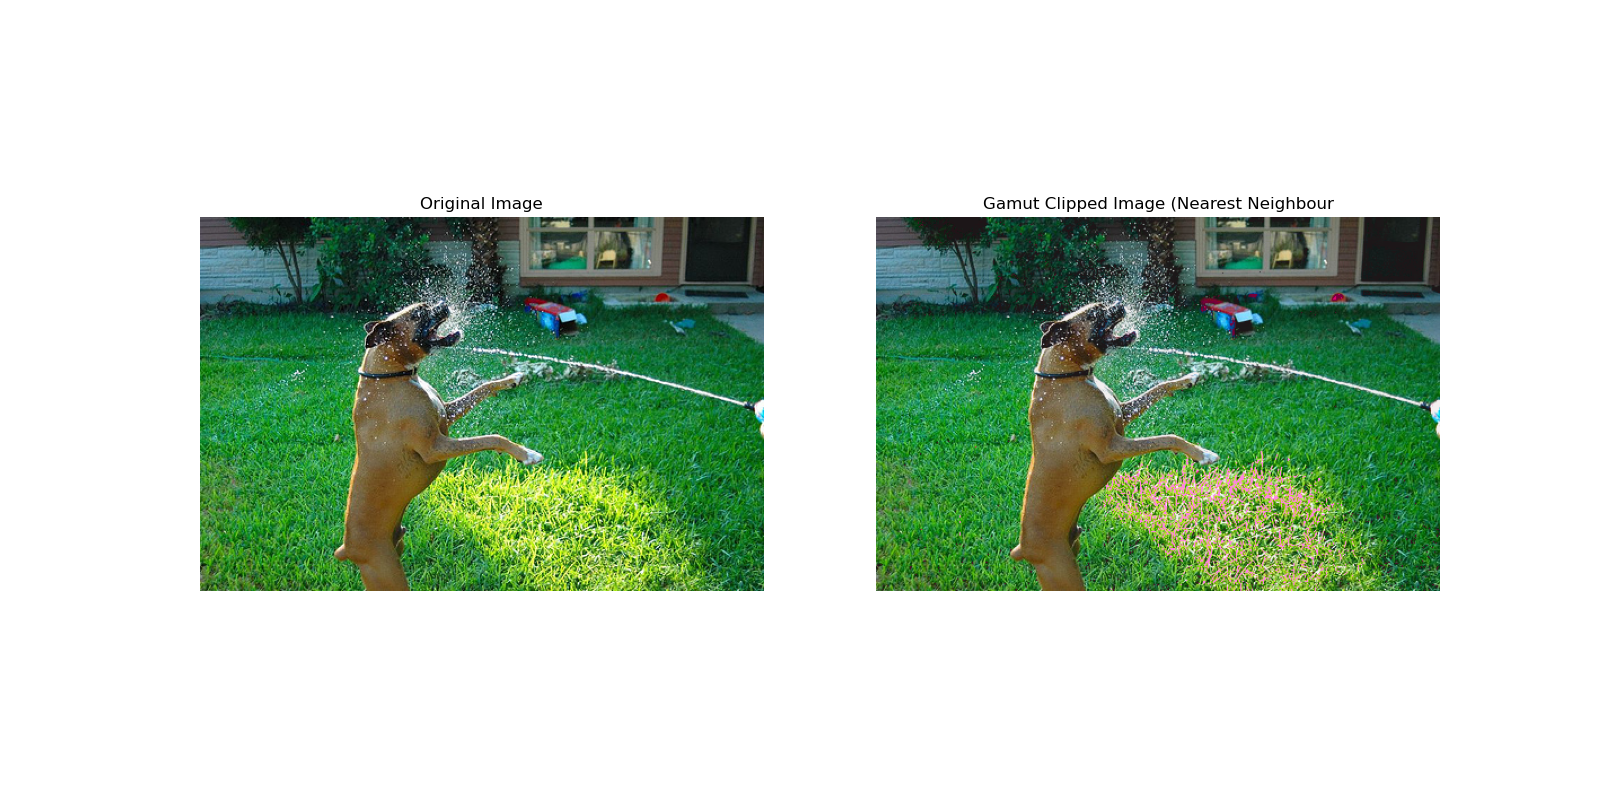
09.09.2024: A method to implement nearest neighbor gamut clipping
A nearest neighbor gamut clipping where an RGB image is transformed to fit within the CMYK gamut, specifically using the Fogra39 dataset is presented. The process converts the image from RGB to the perceptually uniform LAB and LCH color spaces. A convex hull is then computed for both the RGB image and the CMYK (Fogra39) dataset in the LCH color space. Any colors in the RGB image that fall outside the CMYK gamut are mapped to their nearest neighbor on the boundary of the CMYK convex hull using Euclidean distance. The clipped LCH values are then converted back to LAB and subsequently to RGB for image reconstruction. The results show that the clipped image retains most of its original appearance, but with some desaturation, particularly in highly saturated colors, which is a natural consequence of fitting a broader RGB color space into the narrower CMYK gamut. A Delta E 2000 value of 2.2723 is obtained.
Source code | Mathematical background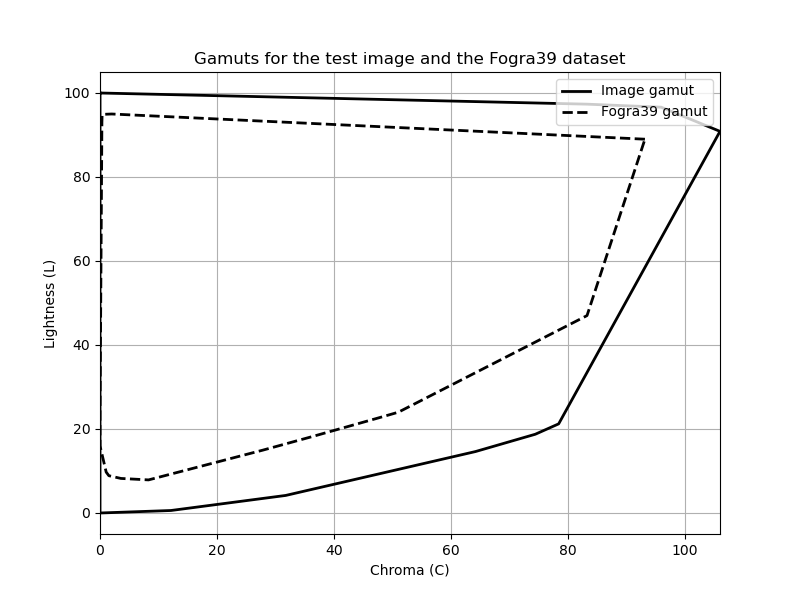
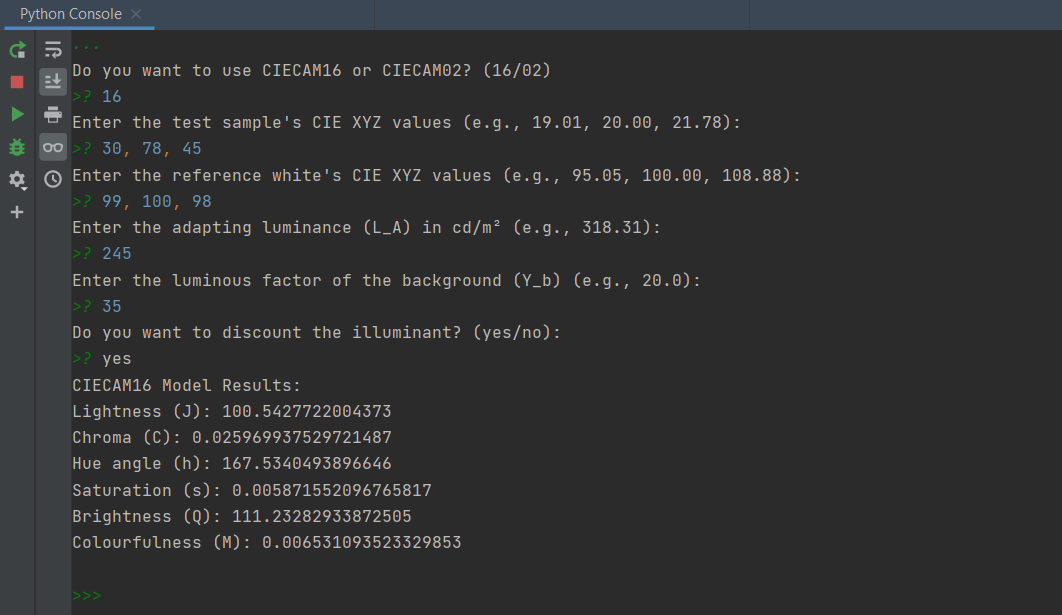
04.09.2024: A method for transforming tristimulus value to perceptual correlates using CIECAM models
A method is presented that allows users to convert CIE XYZ tristimulus values into perceptual correlates using either the CIECAM16 or CIECAM02 color appearance models. The code takes input from the user, including the test sample's XYZ values, the reference white's XYZ values, adapting luminance, and background luminance, and computes key appearance attributes such as lightness, chroma, hue, saturation, brightness, and colorfulness. Based on the user's choice of model (CIECAM16 or CIECAM02), the code applies the corresponding mathematical transformations, including chromatic adaptation, non-linear compression, and opponent color dimension calculations, and returns the predicted perceptual correlates for the given viewing conditions.
Source code | Mathematical background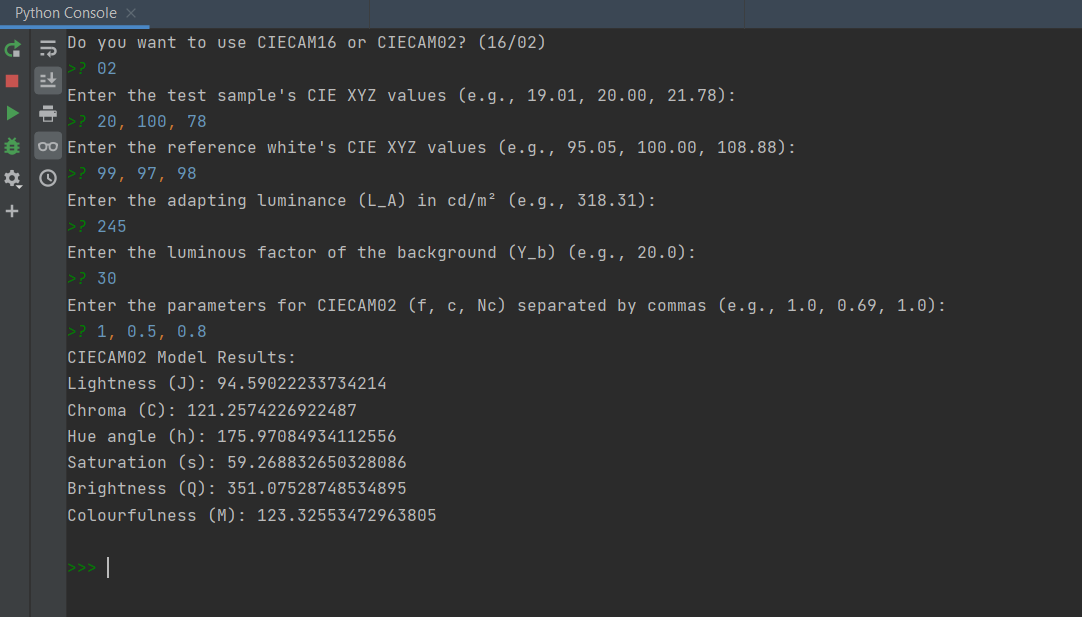
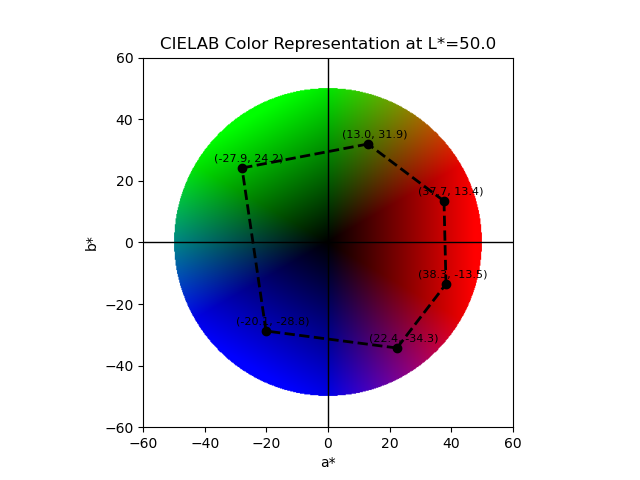
04.09.2024: A method for visualizing the CIELAB space at constant lightness planes
A method is presented here that is designed to allow a user to explore and interact with the CIELAB color space. It allows users to specify a lightness value and interactively click on points in a 2D plot representing the a* and b* color axes. The clicked points are annotated with their respective a* and b* coordinates. Once a specified number of points is selected, the convex hull is drawn around these points, representing the boundary enclosing these selected colors in the CIELAB space.
Source code | Mathematical background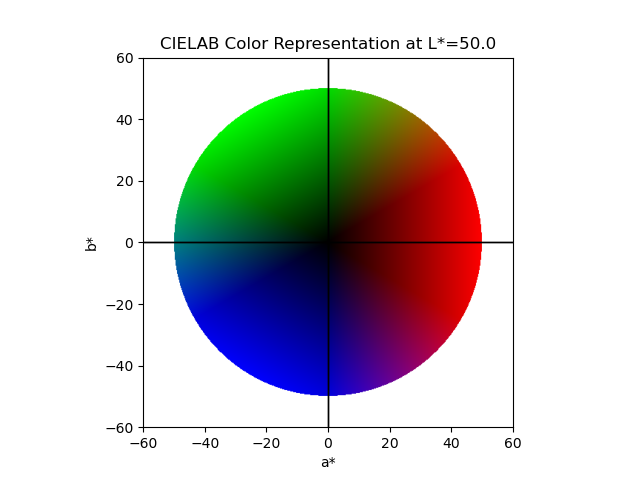
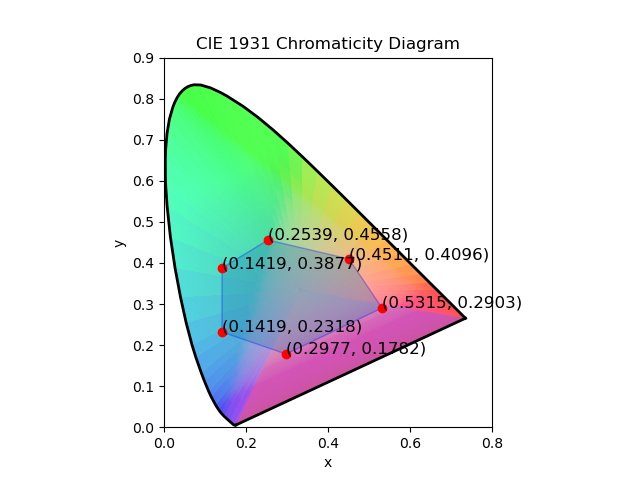
03.09.2024: A method for plotting the gamut for multiple chromaticities
A method has been presented that creates the CIE 1931 chromaticity diagram and asks users for input on the number of colors they would want to plot in the space. Given a fixed number of points, the method then computes the convex hull between them and returns the color gamut in the xy space enclosed by the colors.
Source code | Mathematical background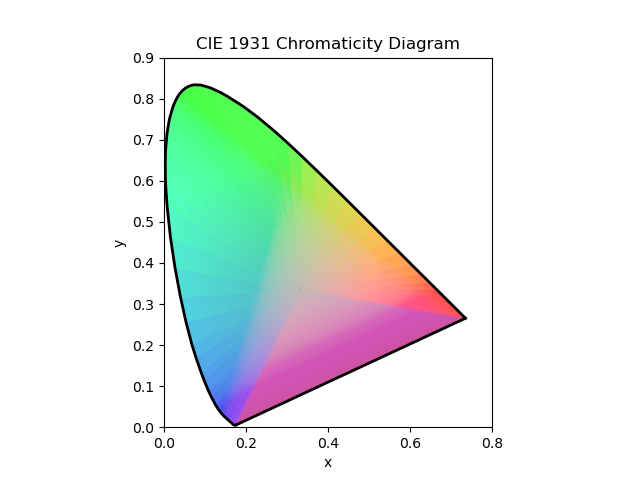
02.09.2024: Comparison of techniques for halftone printer characterization
A method has been presented that evaluates the accuracy of various interpolation techniques for the characterization of a half-tone printer using the FOGRA39 dataset, which includes CMYK inputs and corresponding LAB color values. The techniques compared include Distance-Weighted Interpolation, Nearest Neighbor Interpolation, Linear Interpolation, 2nd and 3rd Degree Polynomial Fitting, and an optimized Neural Network. The dataset was split into training and testing sets, and each method was used to predict the LAB values for the test set, with accuracy measured by the mean CIELAB color difference (ΔE). The results show that Linear Interpolation performed best with a mean ΔE of 0.14, closely followed by 3rd Degree Polynomial Fitting with a mean ΔE of 0.62. Distance-Weighted Interpolation and 2nd Degree Polynomial Fitting also showed reasonable accuracy, with mean ΔE values of 2.28 and 1.83, respectively. In contrast, the Nearest Neighbor Interpolation and the Neural Network methods yielded higher mean ΔE values of 3.97 and 3.95, respectively, indicating less accuracy. However, since this work was carried out using the characterization dataset, the results can vary dramatically if real world color data is used.
Source code | Mathematical background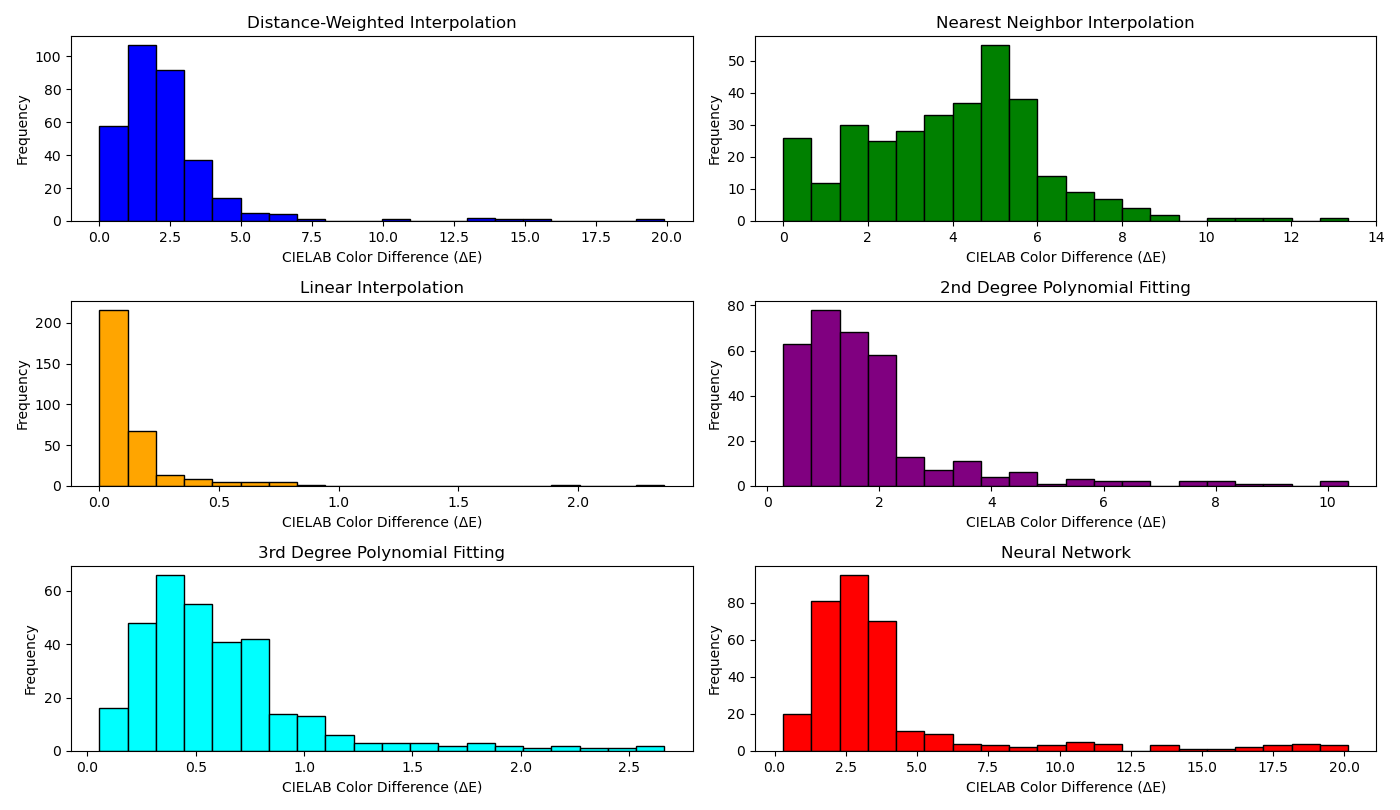
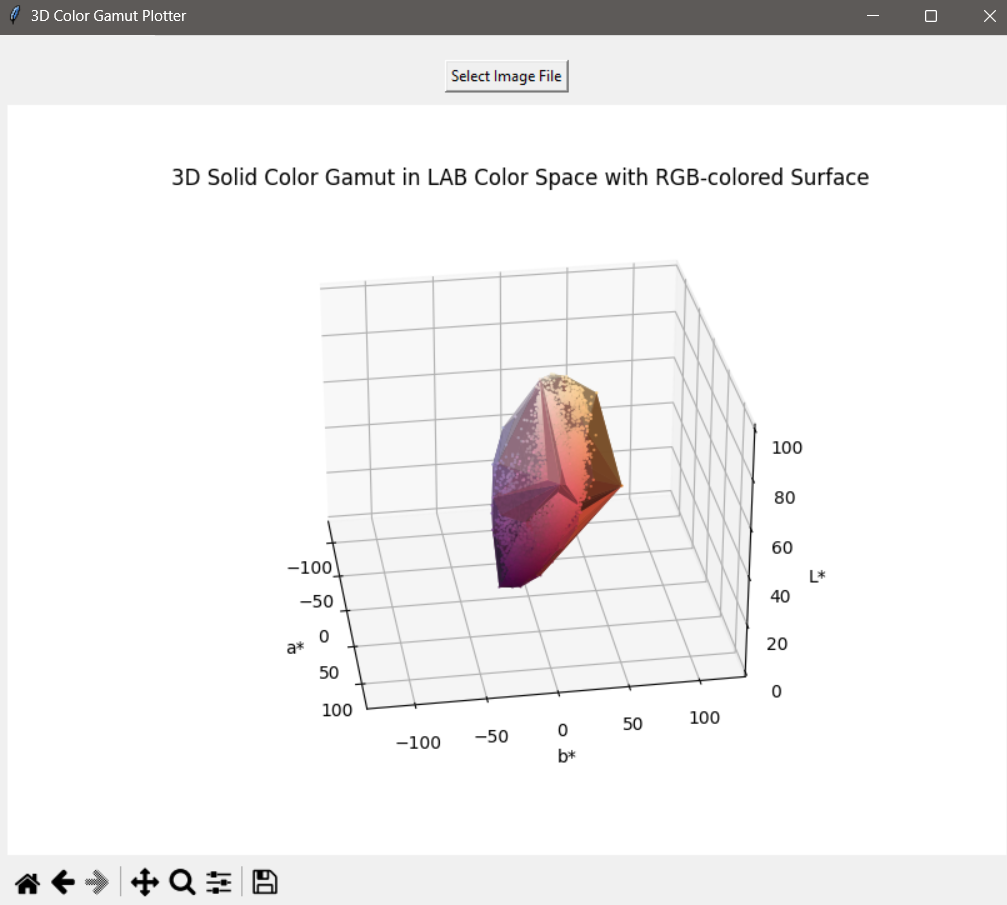
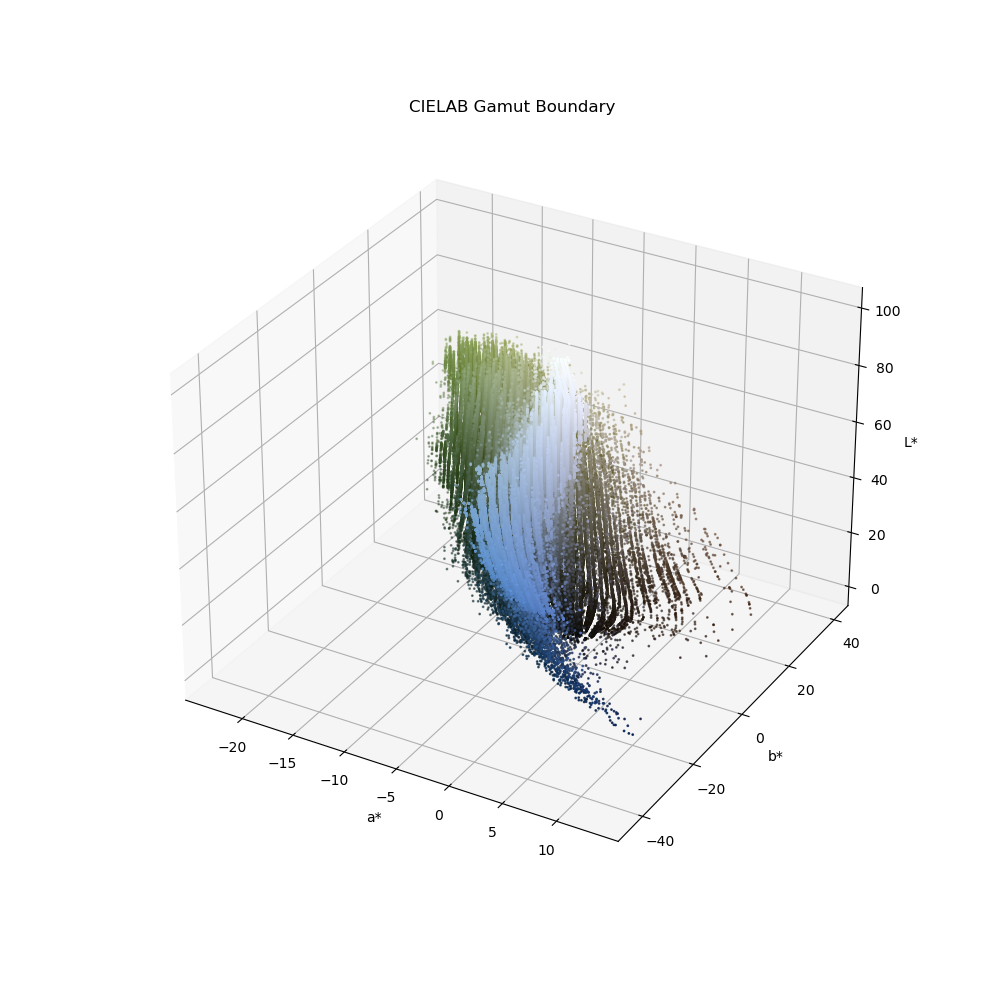
01.09.2024: A 3D Color Gamut Viewer Application for Windows
An application that takes an image as input and displays the 3D color gamut of the colors in the image for Windows OS that I have developed in Python is presented here. The code takes in the RGB data converts them to LAB colors and plots them in the space. A convex hull is used to compute the GBD. It also plots the convex hull surface by connecting the points in the LAB space. For each triangle in the convex hull, the script plots a surface using the average RGB color of the triangle’s vertices.
Source code | Mathematical background | Download the installer for the Color Gamut Viewer app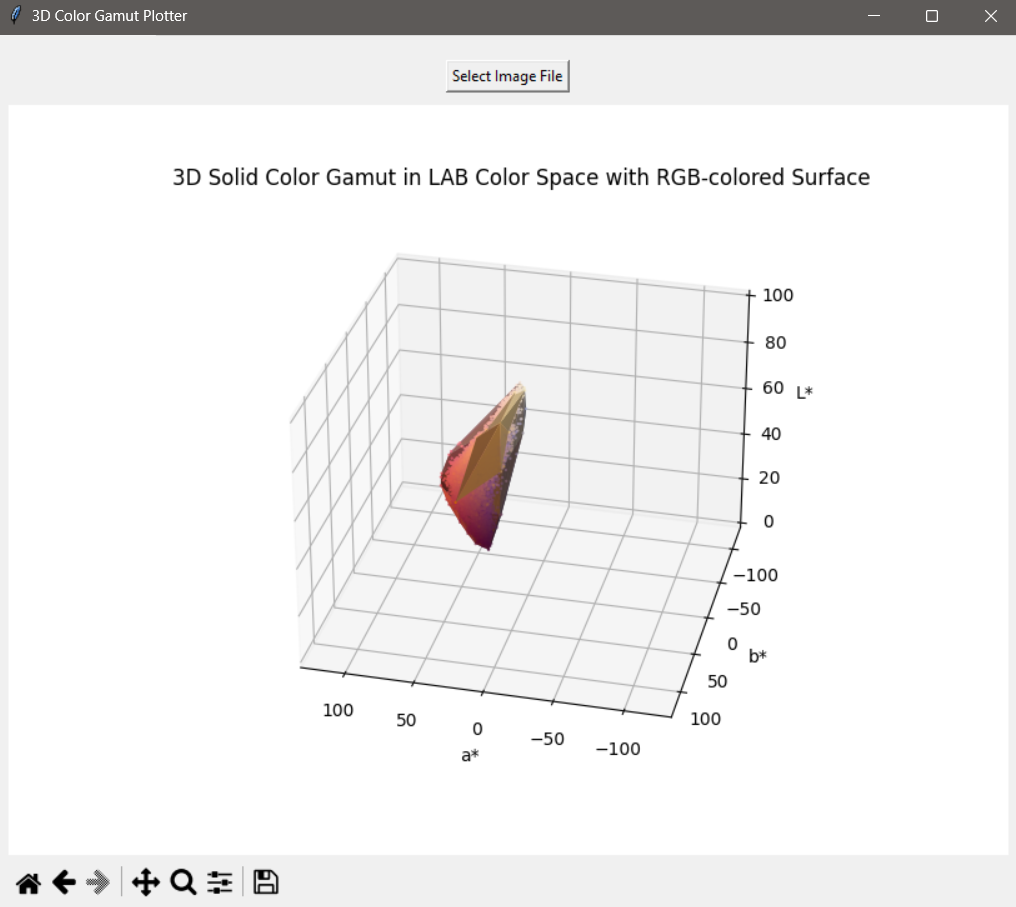
31.08.2024: A simple amplitude modulated halftoning technique
This code implements the halftoning process, which has been adapted from this source. The code is structured around a Python class called `HalftoneGenerator`, which provides a method to convert an image into its halftone representation. Depending on the user’s preferences, the code can generate either a grayscale or color halftone image. It processes each color channel (Cyan, Magenta, Yellow, and Black) separately, applying a rotation to avoid visual artifacts and then calculating the size of the dots based on the average intensity of the image in sampled regions. The code also offers flexibility in adjusting various parameters such as the size of the sample boxes, the scaling factor for dot size, the percentage of gray component removal, and the format in which the output images are saved.
Source code | Mathematical background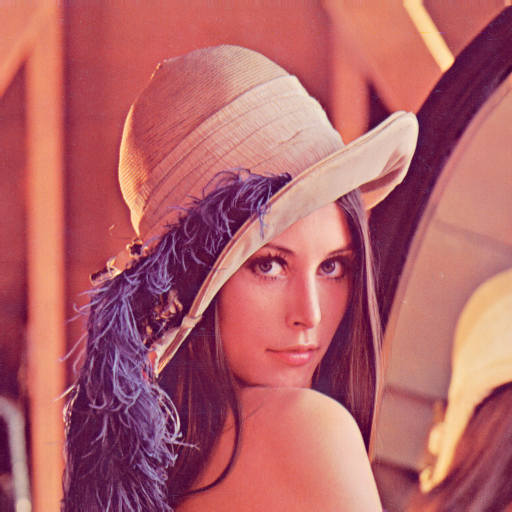


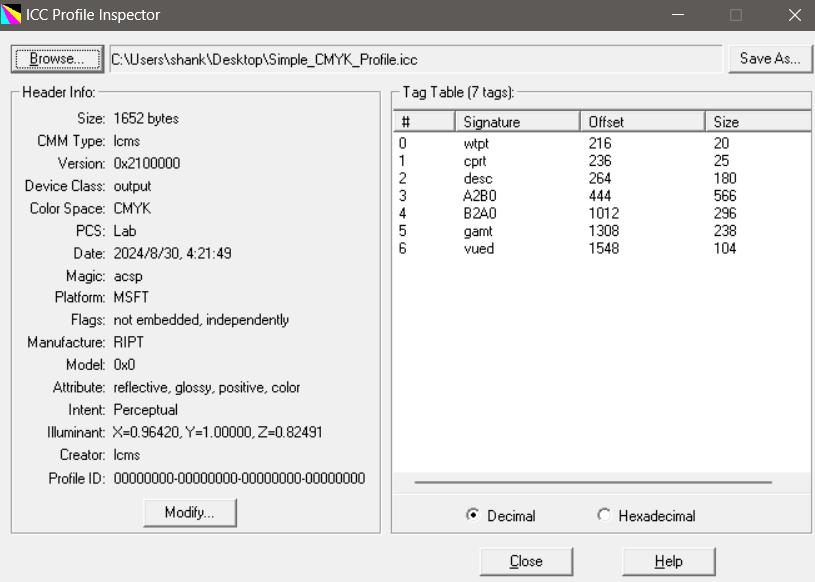
30.08.2024: Simple display class and output class ICC profiles using LCMS
Two C codes have been presented for the purpose of creating ICC profiles using the Little CMS (lcms) library, focusing on both sRGB and CMYK color spaces. For the sRGB profile defines the D65 white point, defining sRGB primaries, and tone reproduction curves (TRCs) specific to the sRGB color space. Other profile headers are also included such as the profile version, device class, and manufacturer signature, as well as the key tags like the media white point and profile description. The other code presents a method for creating a CMYK ICC profile for printers. The profile uses a transformation pipelines using look-up tables (LUTs) for converting between the CMYK space and the Profile Connection Space (PCS). A random data for the `AToB0` and `BToA0` tags due to the absence of real measurement data. The data obtained from the earlier post (ColorChecker) for instance can be used to populate the A2B CLUT and the code will create the corresponding B2A CLUT. For simplicity only A2B0 CLUT have been presented in the code and that too represents an identify matrix. Both the codes use the lcms library's capabilities to create and manage ICC profiles.
Source code for sRGB profile | Elaboration on the sRGB profile | Source code for CMYK profile | Elaboration on the CMYK profile | Little CMS | ICC Profile Inspector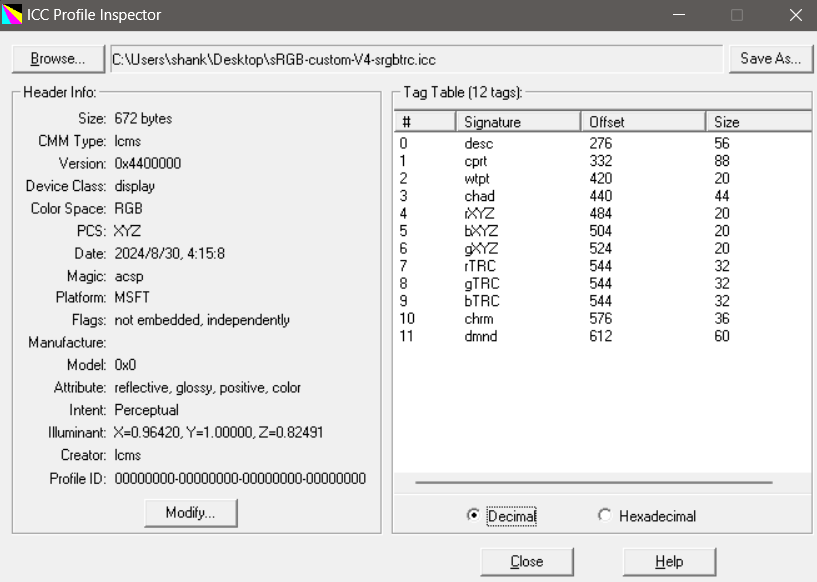
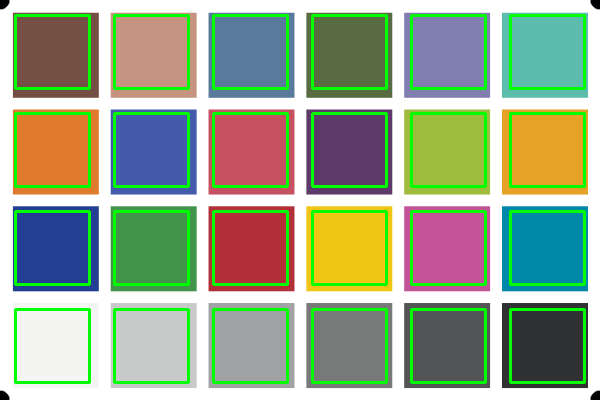
25.08.2024: A method for color test target generation and extraction of color values
A method is presented for generating a color test target based on user-defined LAB values and extracting RGB values from a scanned image of the target. These processes involve color space transformations, perspective geometry, and statistical methods. The test target has been made in accordance to the Gretag ColorChecker target. It contains 24 patches.
Source code for target generation | Source code for reading test target | Mathematical background on the process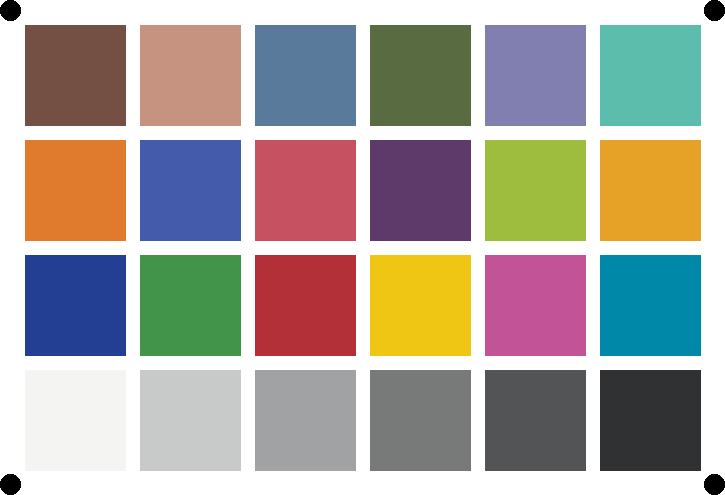
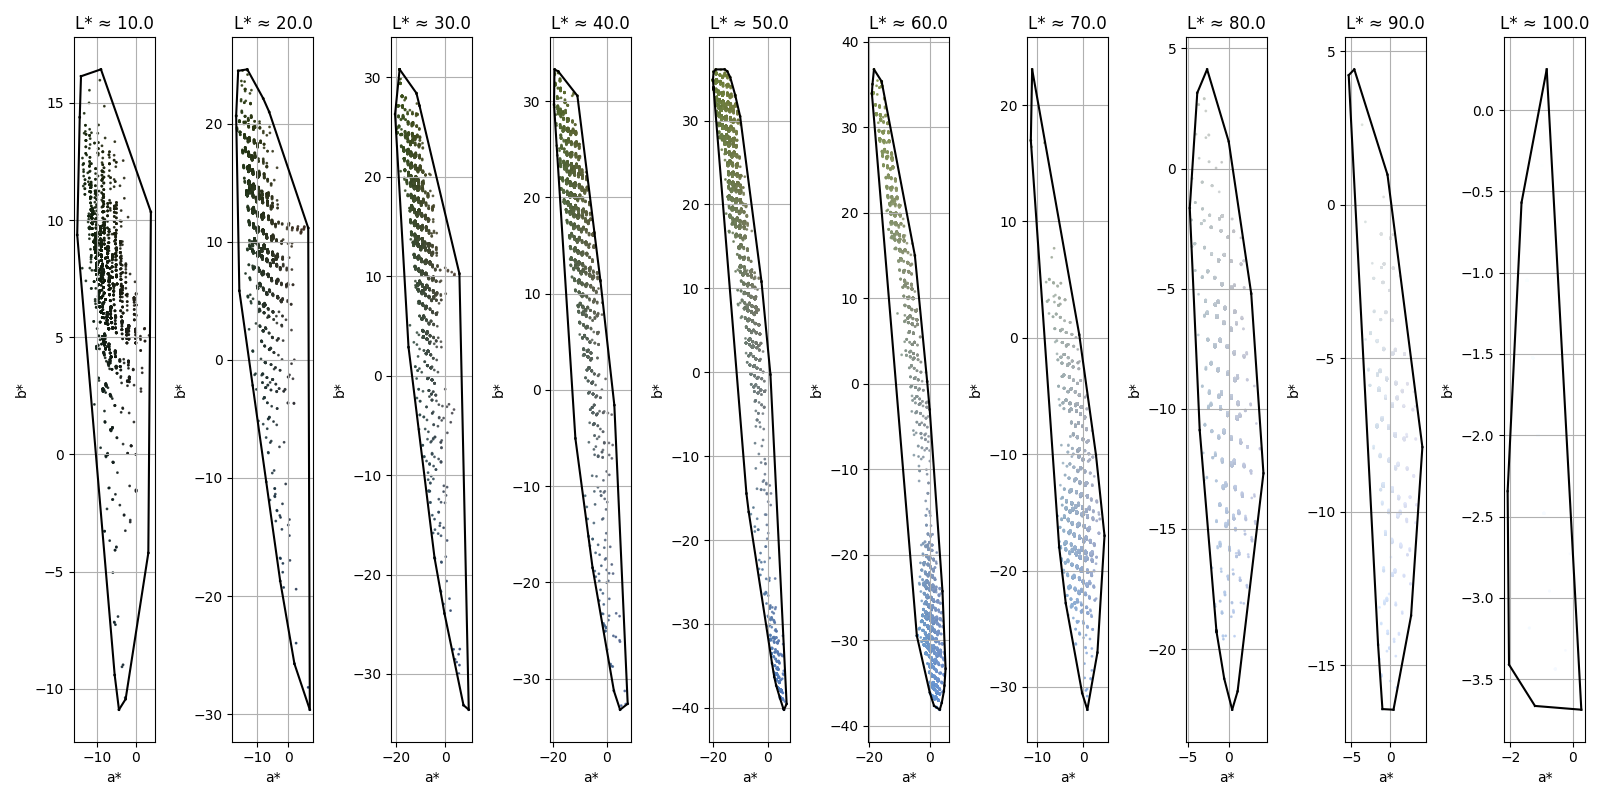
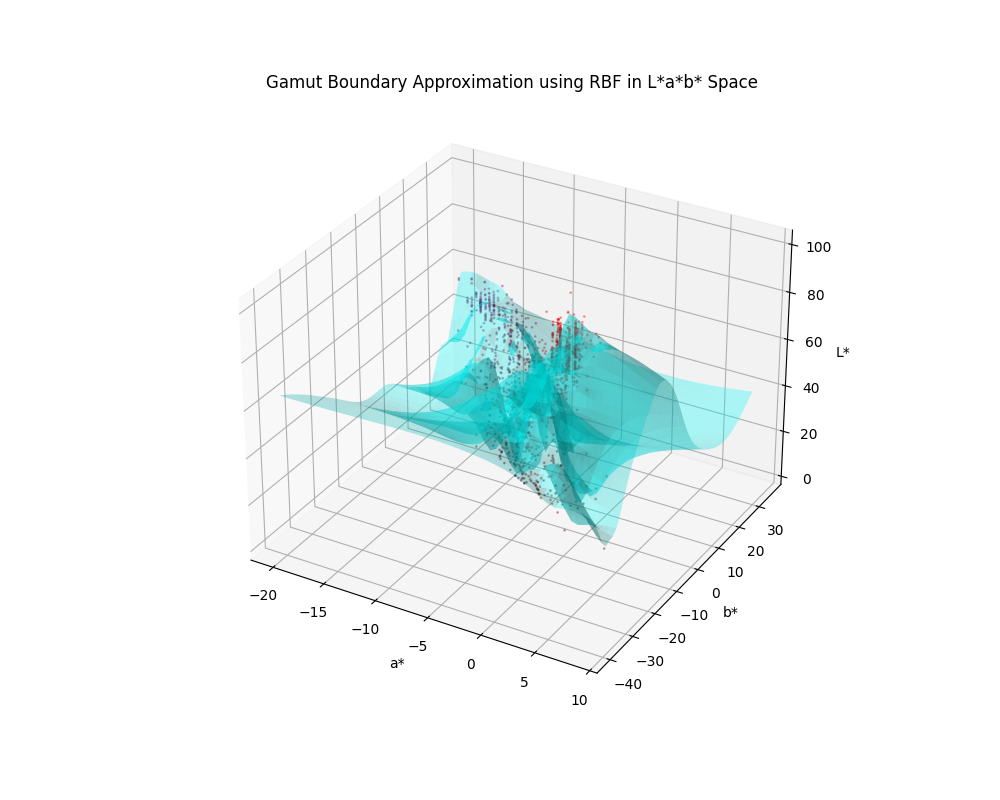
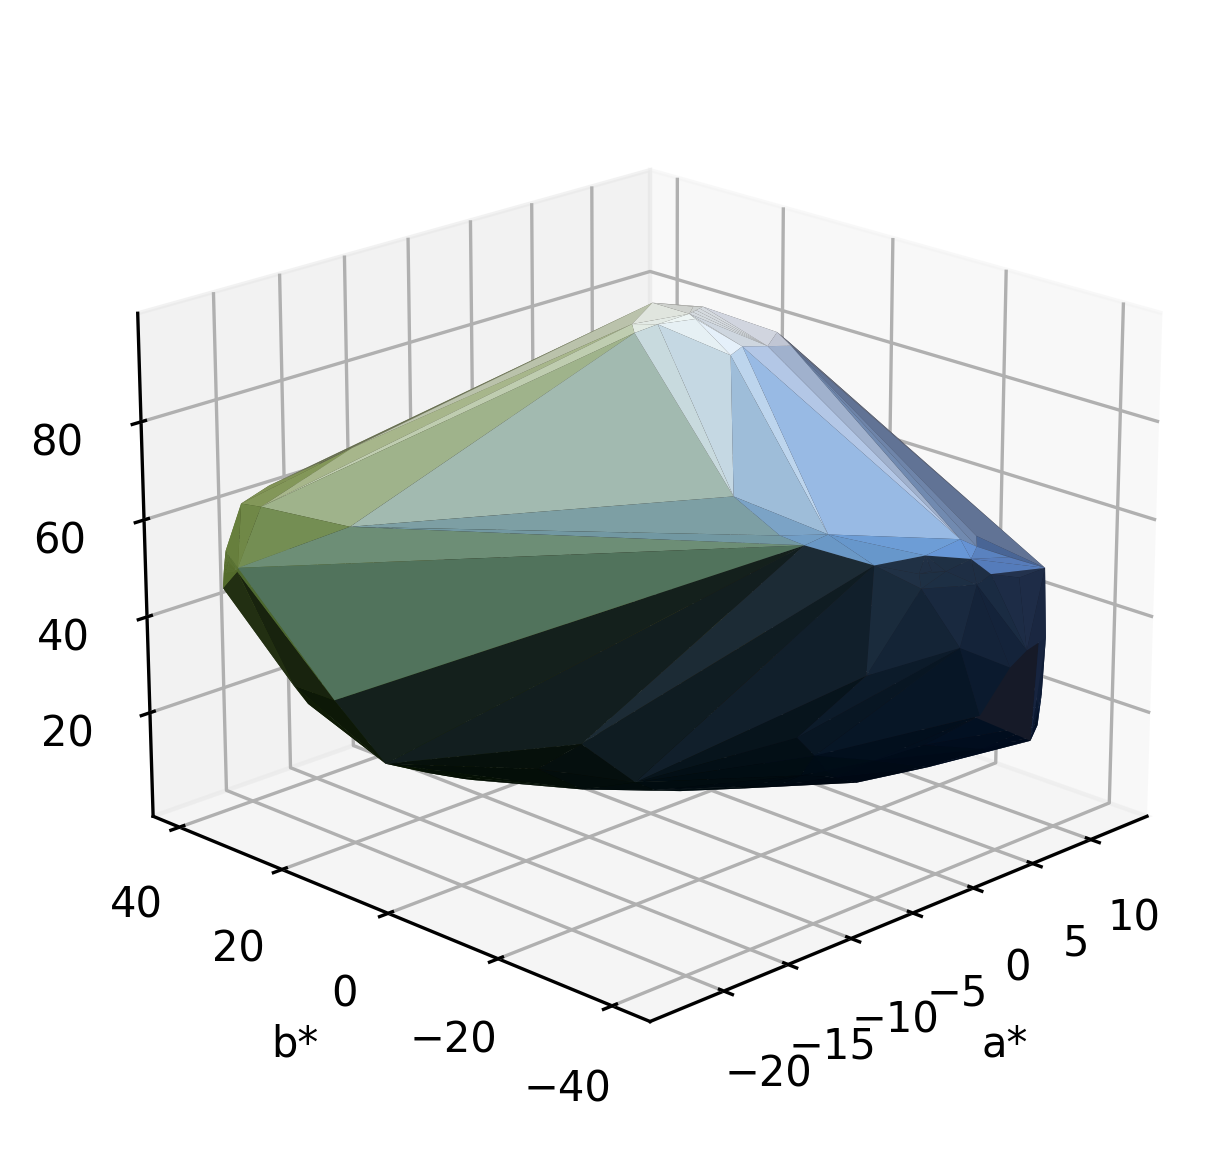
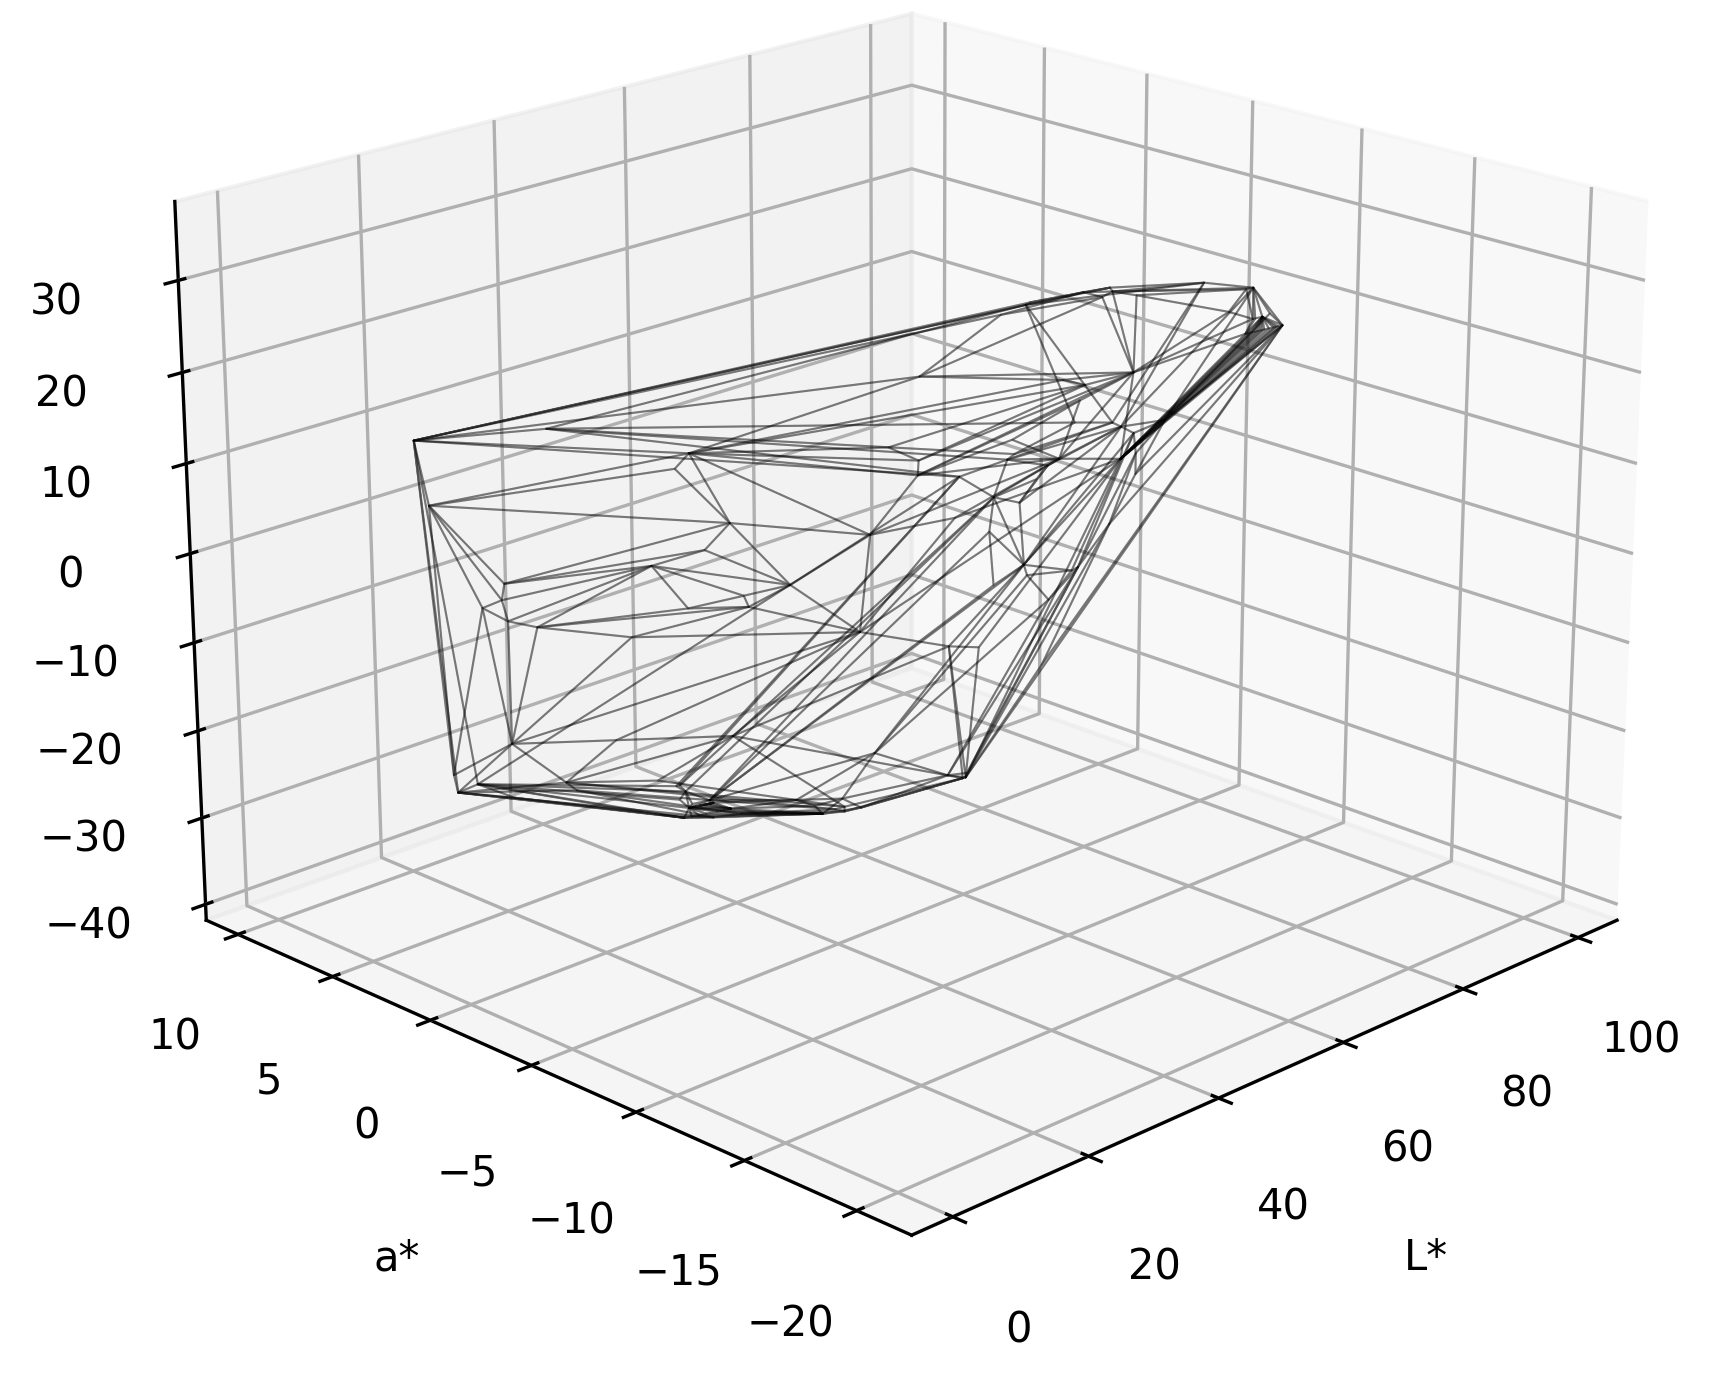
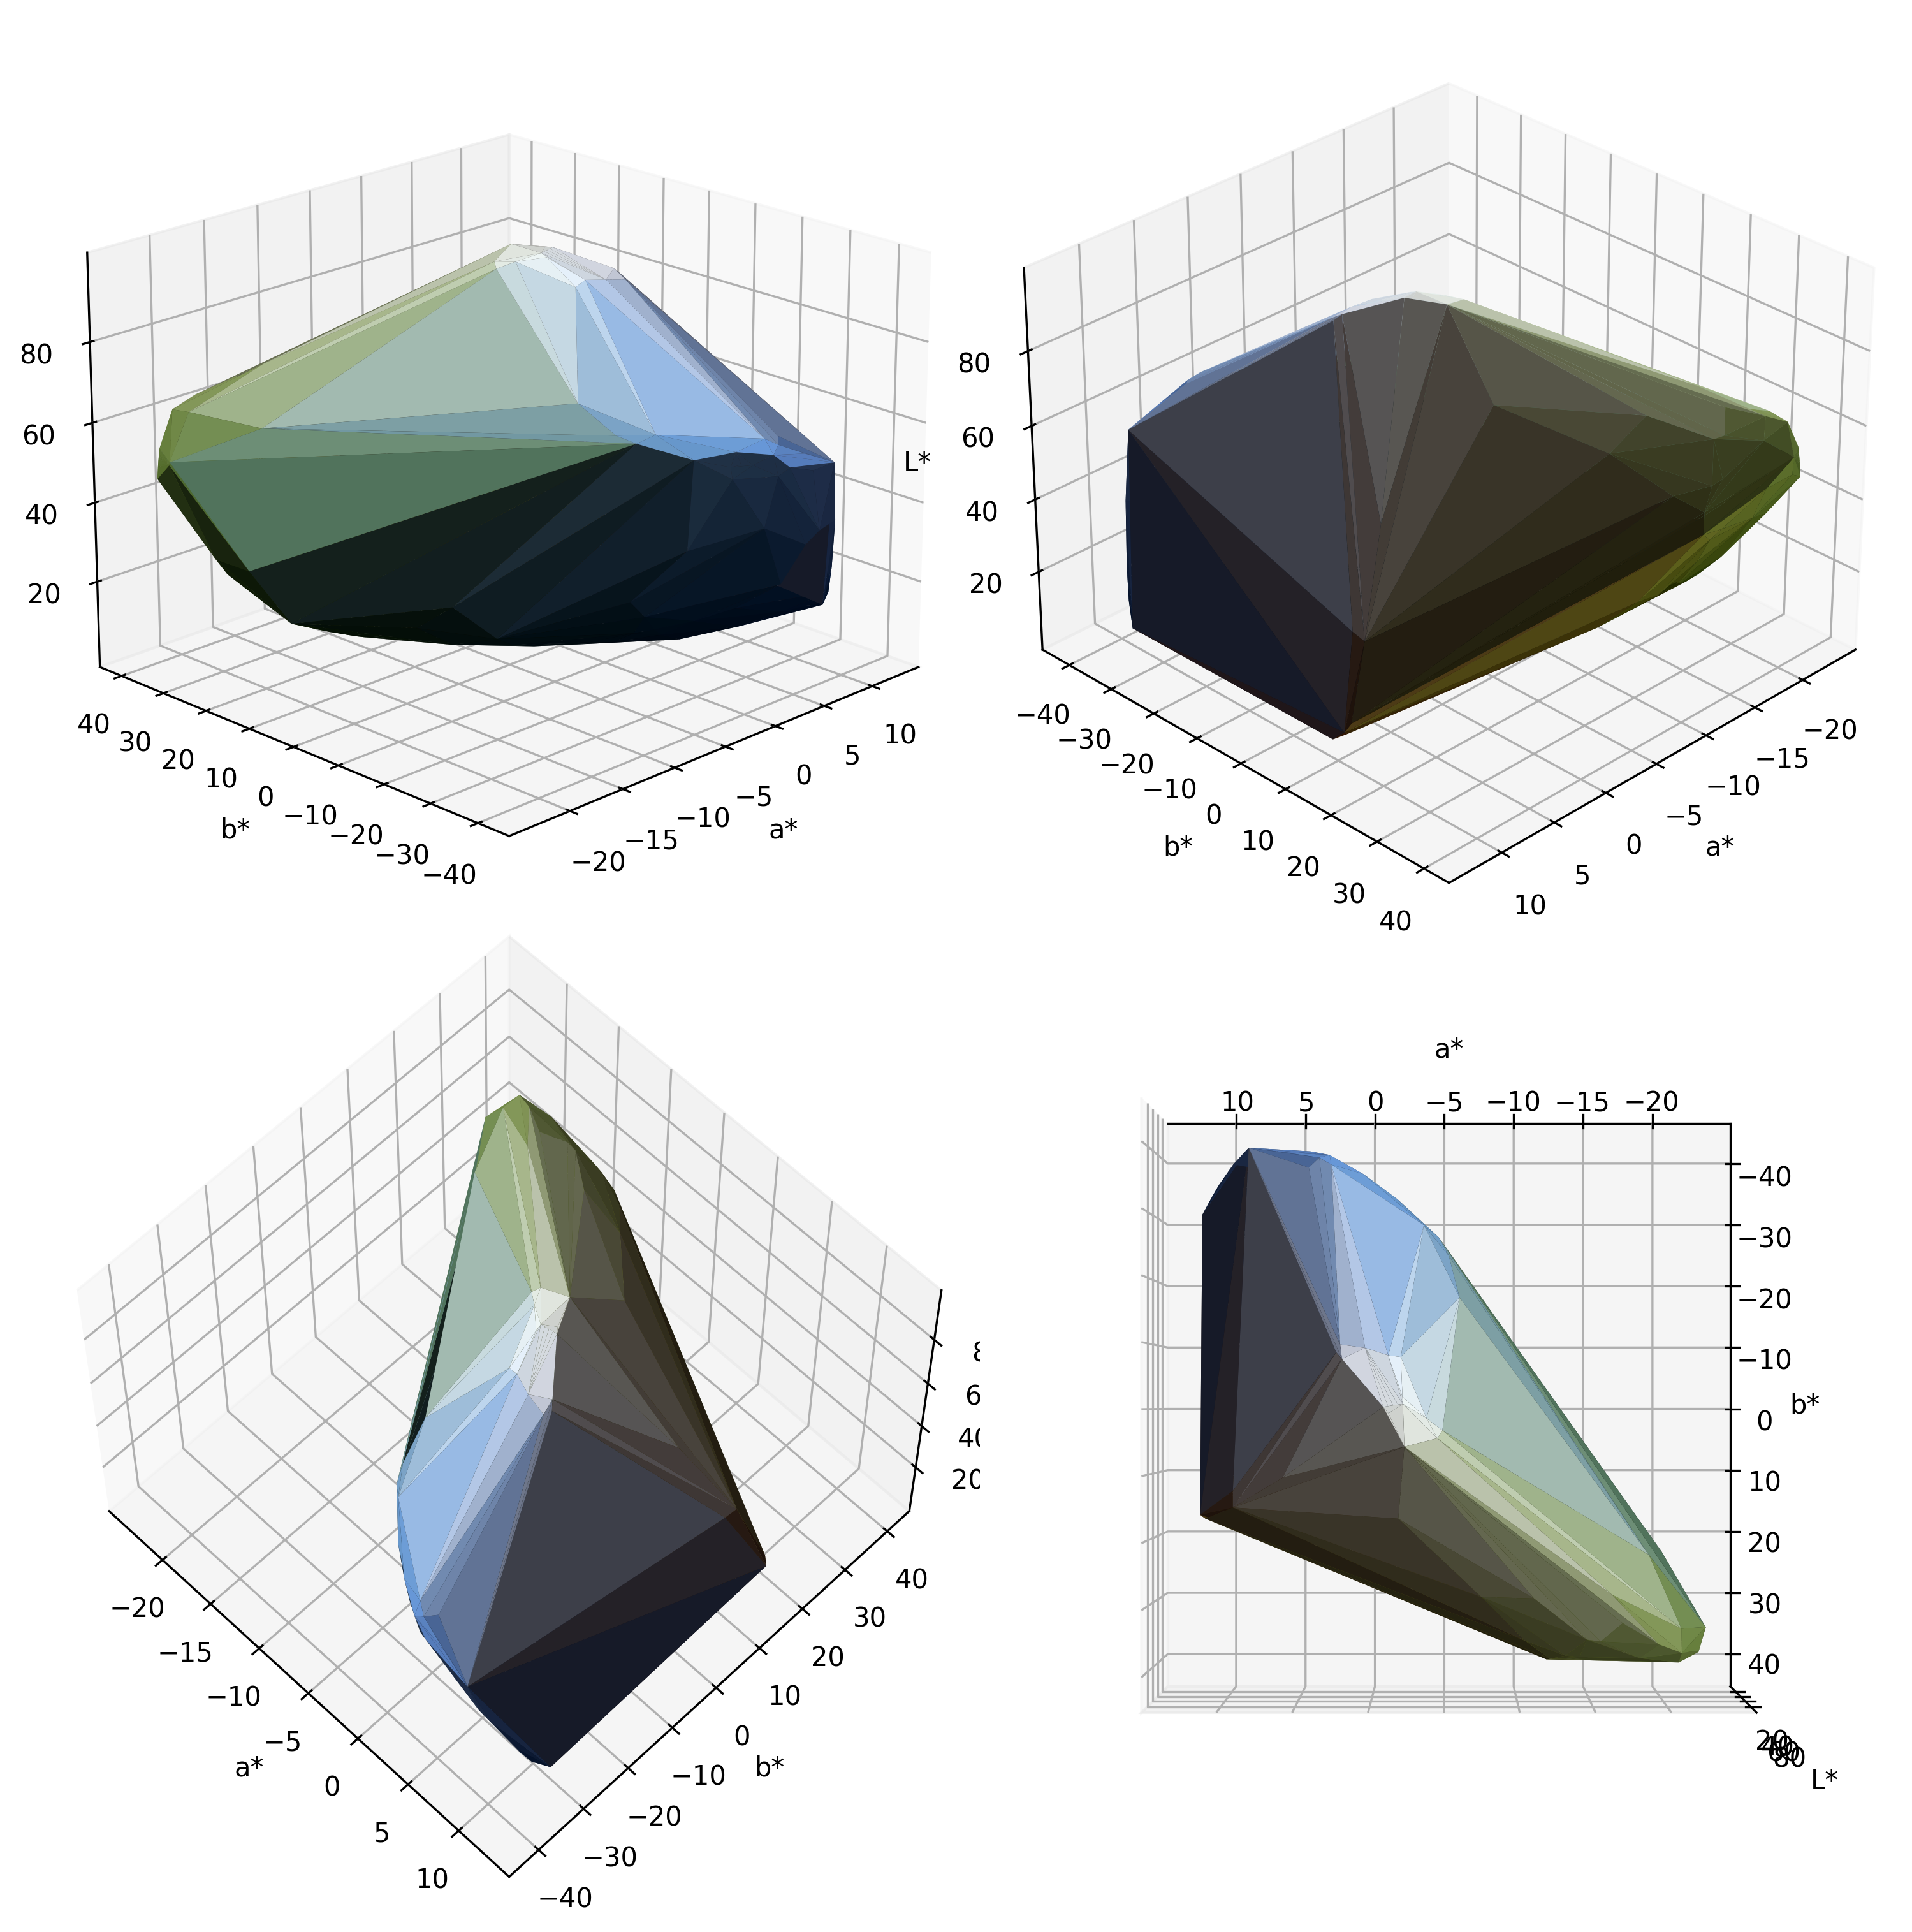
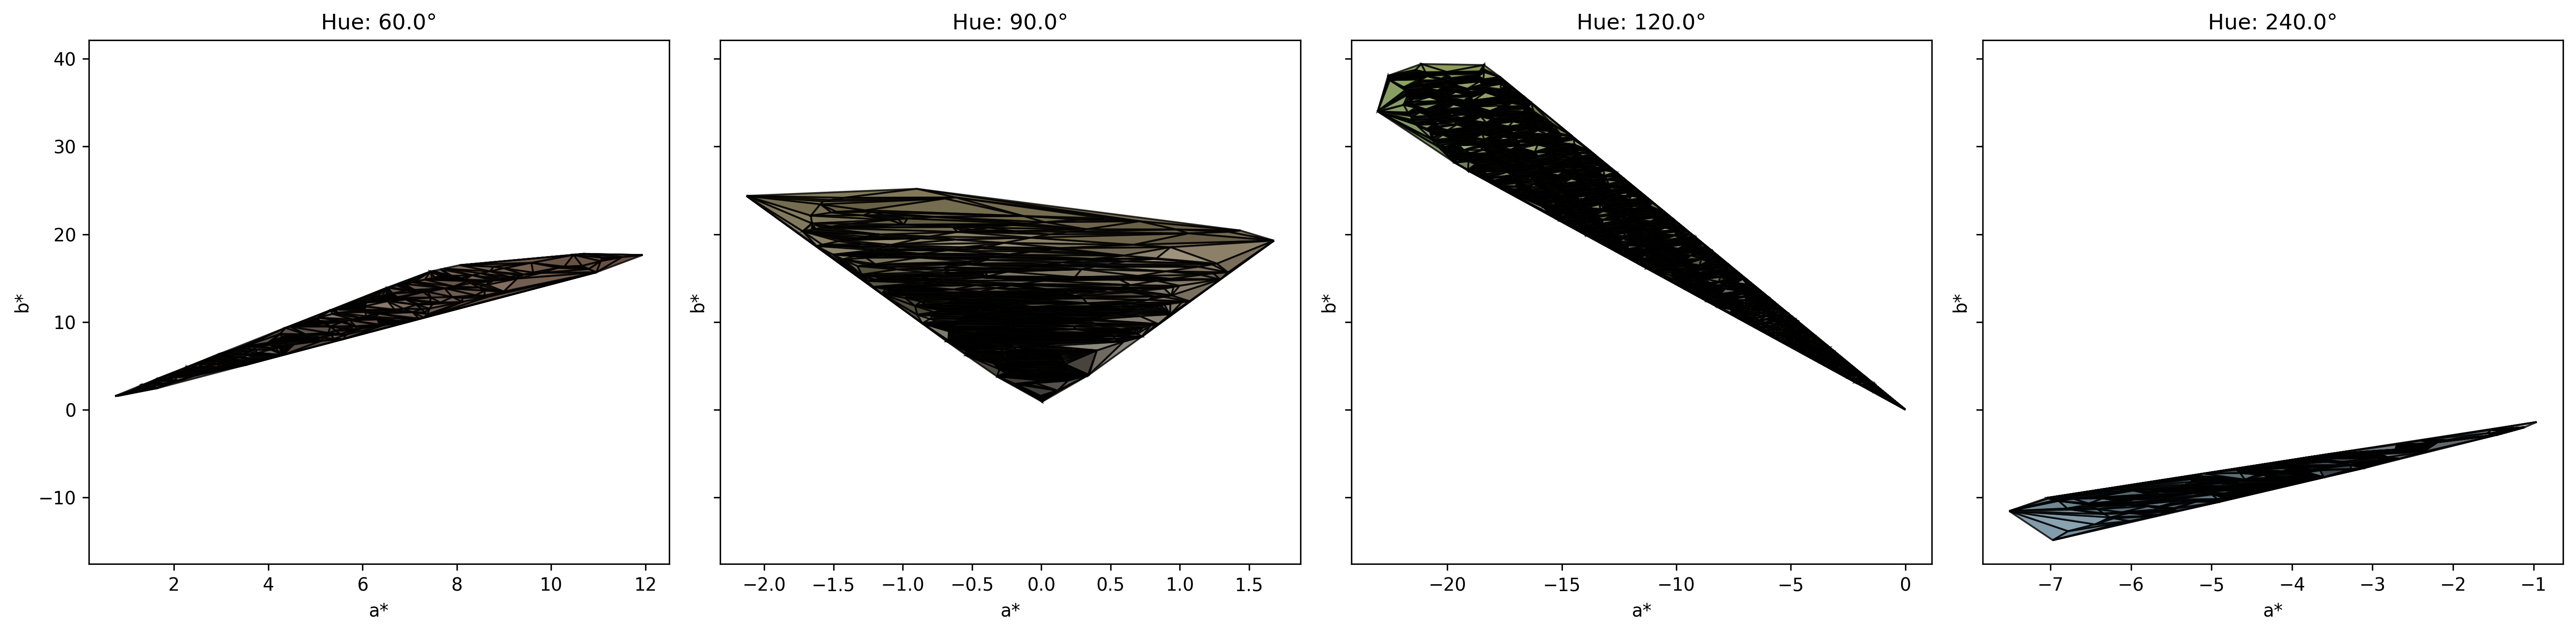
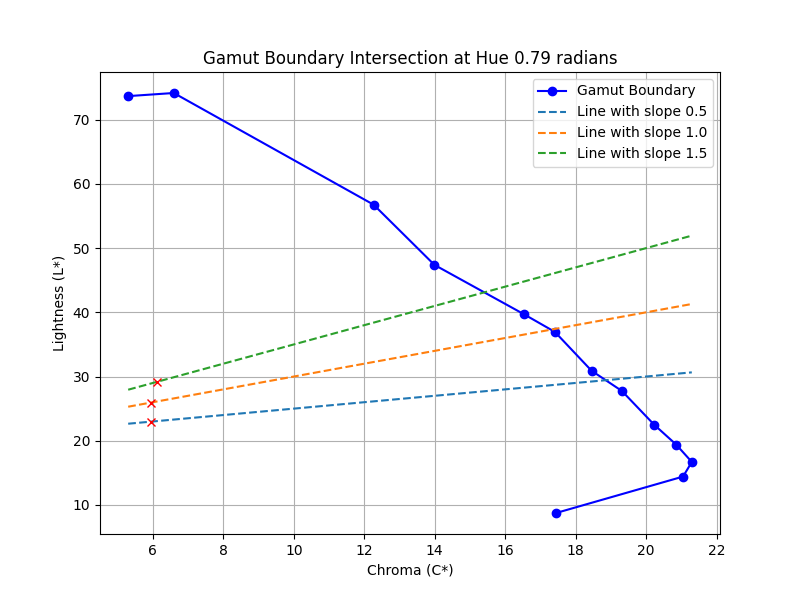
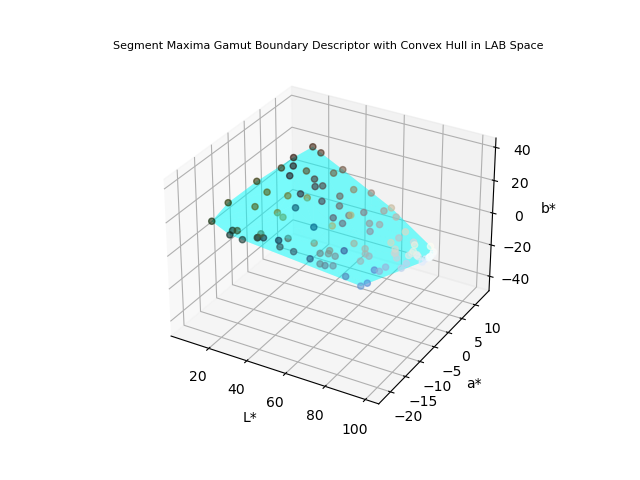
24.08.2024: Implementation of an improved segment maxima based GBD and other GBD methods
Various methods for calculating Gamut Boundary Descriptors have been implemented. In an earlier post, I had presented a method for calculating GBD using segment maxima method, with enclosing surface covered by convex hull. In this new method, I have used delaunay triangulation to enclose the surface using simplices. The gamut surfaces have been colorized to depict their corresponding L*a*b* values, a wireframe gamut surface have also been presented. I have also plotted the gamut at constant L* values in the a*-b* plane. Another approach have also been implemente, where a RBF has been used to compute and plot GBD of an image. Constrained Line Gamut Boundary (CLGB) and Flexible Sequential Gamut Boundary (FSLGB) have also been implemented from GBD obtained using segment maxima method.
Source code for 2D GBD single slice | Source code for 2D GBD multiple slice | Mathematical background on 2D GBD | Source code for RBF based GBD | Mathematical background on RBF GBD | Source code for new SMGBD | Source code for multiple views using SMGBD | Mathematical background on new SMGBD | Source code for CLGB | Mathematical background on CLGB | Source code for FLSGB | Mathematical background on FLSGB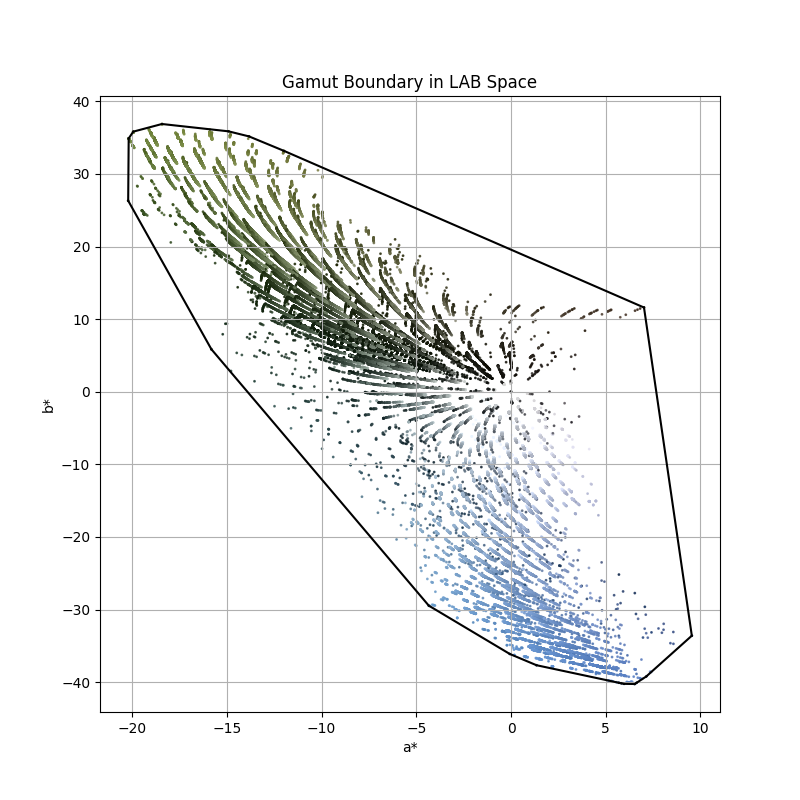
23.08.2024: Implementation of Vividness-Preserved (VP) and Depth-Preserved (DP) Gamut Compression Algorithms
The Vividness-Preserved (VP) and Depth-Preserved (DP) Gamut Compression Algorithms are designed to compress the color gamut of an image while preserving key perceptual attributes. Vividness-Preserved (VP) focuses on maintaining the vividness or saturation of colors during the compression process. This is achieved by scaling both the lightness (L*) and chroma (C*) of each color towards the black point (i.e., reducing their values proportionally), thereby compressing the color gamut into the target space without significantly dulling the colors. The result is a more vibrant image, where the perceived intensity and saturation of colors are preserved as much as possible within the limitations of the target gamut. Depth-Preserved (DP), on the other hand, emphasizes preserving the perceived depth or contrast of the image. The DP method scales lightness towards the cusp lightness (the brightest achievable lightness within the target gamut) while also proportionally scaling chroma. This approach ensures that the contrast between different colors in the image is maintained, preventing the image from appearing washed out or flat after gamut compression. The DP method is particularly useful in scenarios where maintaining the dynamic range of the image is crucial.
Source code | Mathematical background
23.08.2024: Implementation of SGCK (Segmented Gamut Compression with Knee Scaling) Gamut Compression Algorithm
The SGCK (Segmented Gamut Compression with Knee Scaling) Gamut Compression Algorithm is designed to map colors from a wide-gamut source to a narrower target gamut, while preserving perceptual color attributes like lightness and chroma. An implementation of the same has been given. The process involves two main steps: non-linear lightness mapping and knee scaling. In the first step, the lightness (L*) of each color is scaled, and if it exceeds a certain cusp lightness (representing the brightest color within the target gamut), it is capped. In the second step, the chroma (C*) is proportionally scaled to compress the color gamut towards the target space without significantly altering the hue. This approach aims to compress out-of-gamut colors smoothly into the target gamut while minimizing perceptual distortion, thereby preserving the overall appearance of the image even after compression. The SGCK method is effective in applications where maintaining the perceptual attributes of the image during gamut mapping is crucial.
Source code | Mathematical background
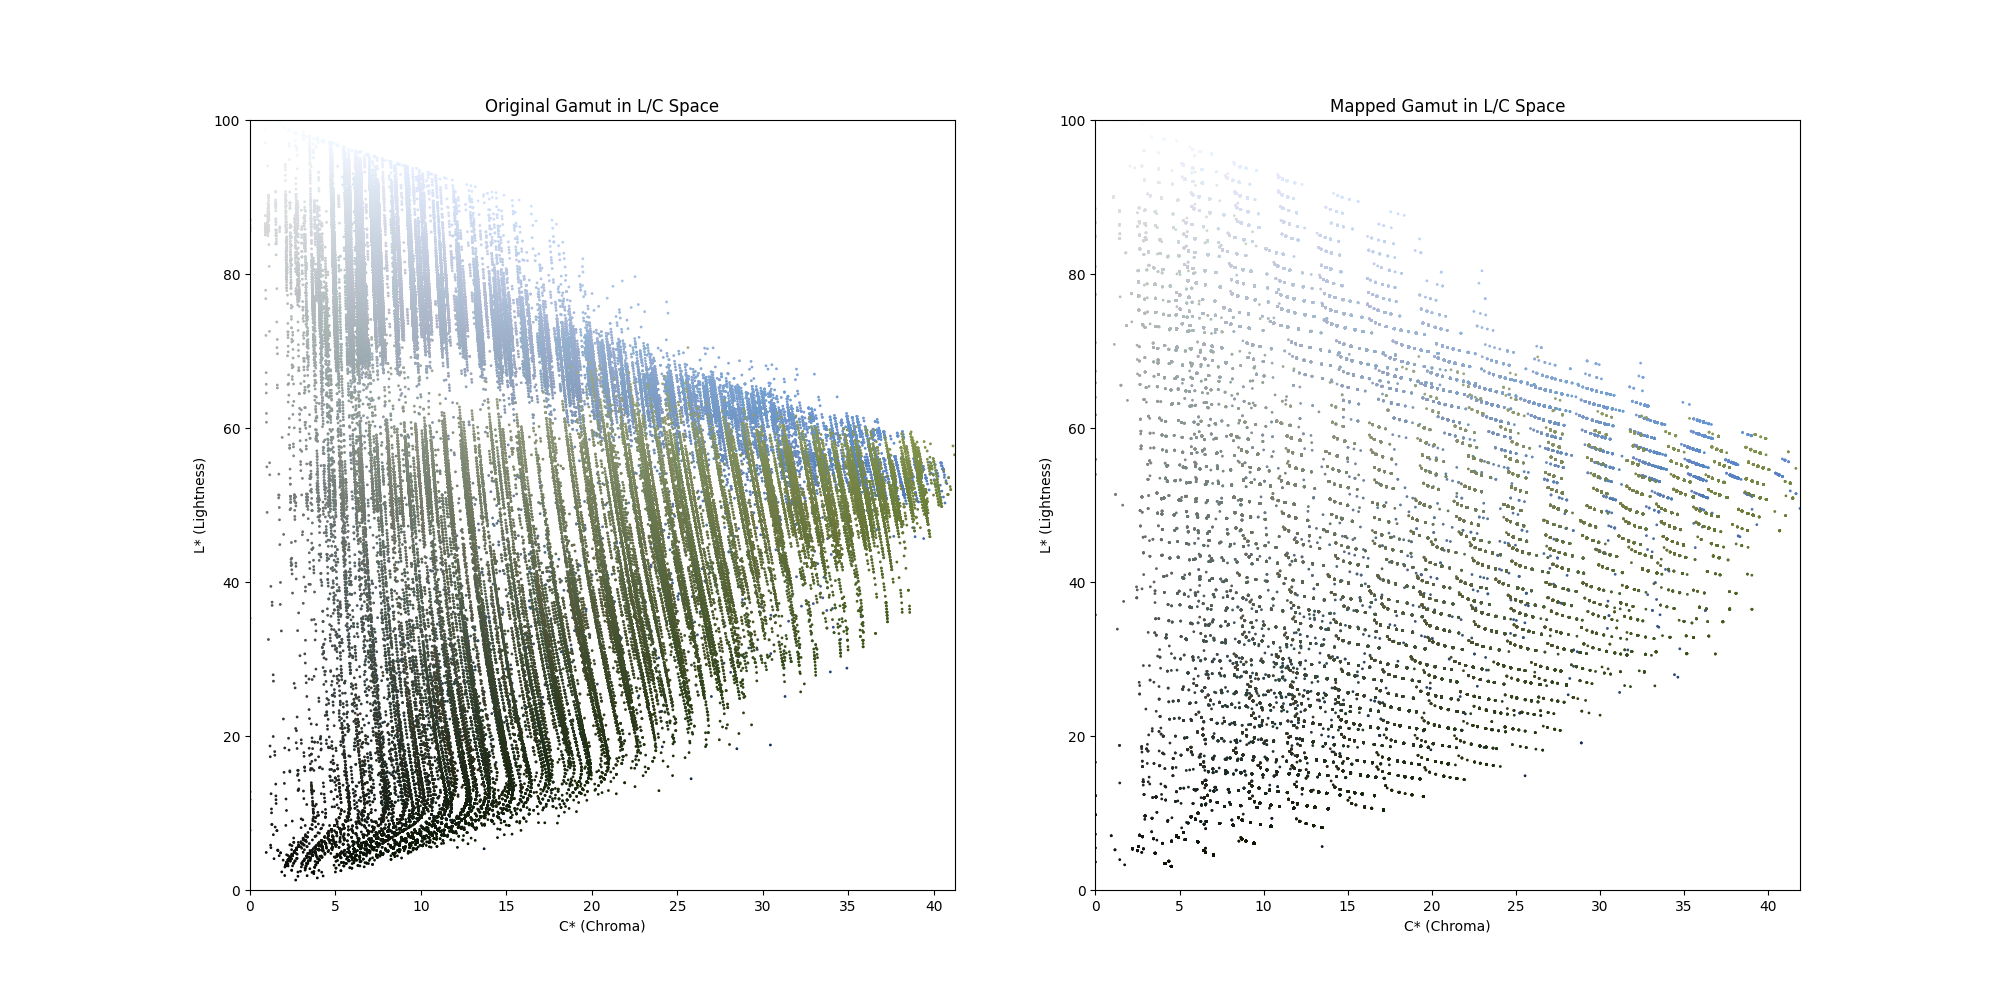
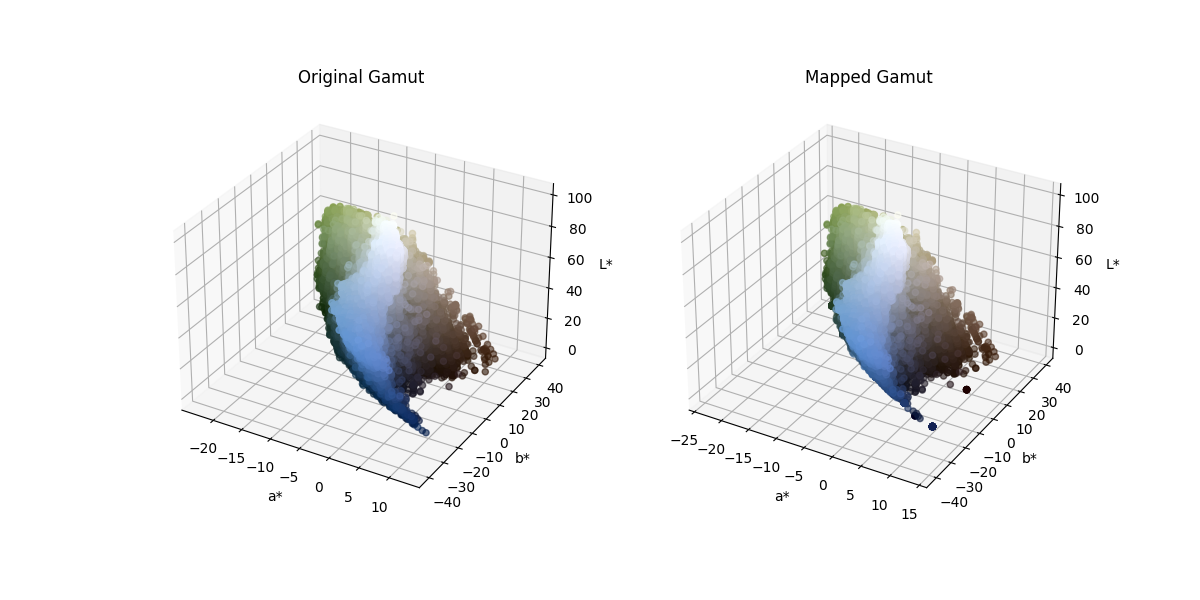
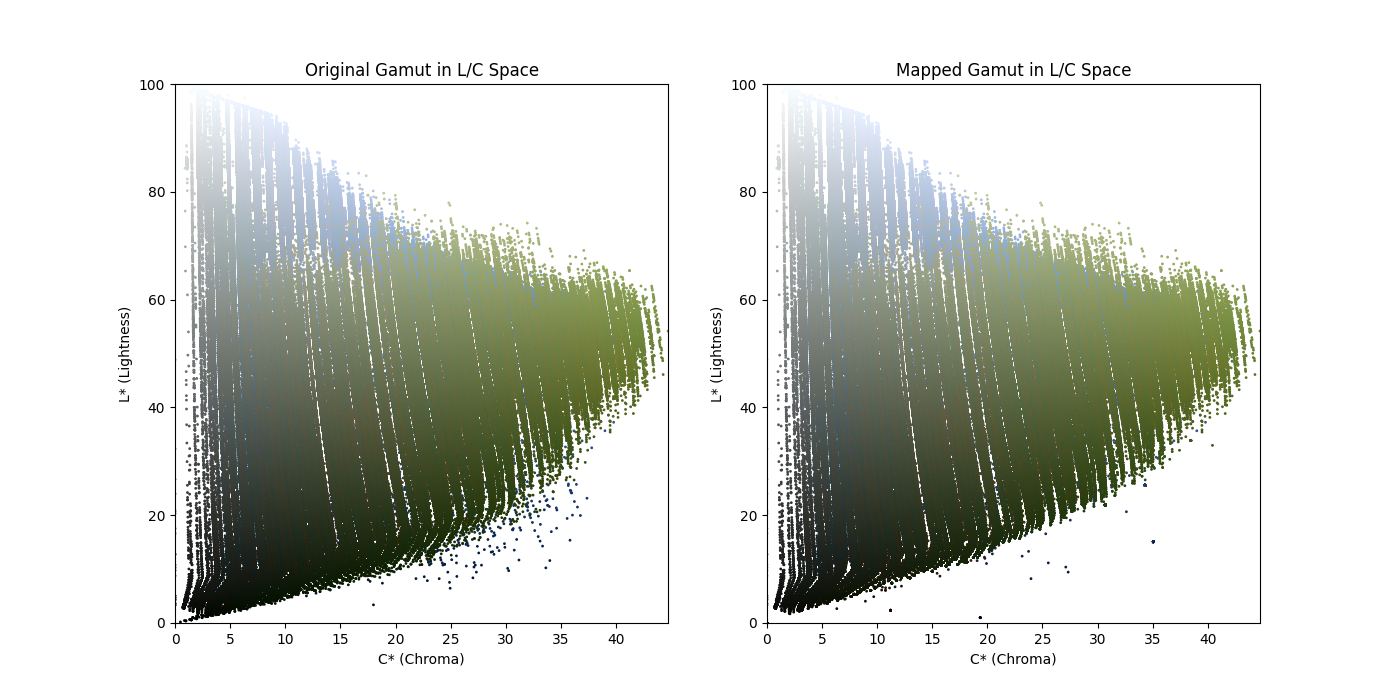
22.08.2024: Implementation of hue preserving minimum color difference gamut clipping (HPMINDE)
The Hue Preserving Minimum Color Difference (HPMINDE) process is a gamut mapping technique designed to map colors from one color space, while preserving the hue and minimizing perceptual color differences. An implementation has been presented that converts an image from sRGB to the CIELAB color space, known for its perceptual uniformity. The AdobeRGB gamut is defined by generating LAB points using an ICC profile, and a convex hull is constructed to represent the Gamut Boundary Descriptor (GBD). The HPMINDE algorithm then maps each color in the image to the closest point on the GBD, ensuring hue preservation and minimizing the weighted color difference, which includes differences in lightness, chroma, and hue angle. The resulting mapped image is compared to the original, showing that while the colors are adjusted to fit within the AdobeRGB gamut, the perceptual differences are minimized, and the hue is well-preserved. The method is effective but can be computationally intensive due to the point-by-point comparison required to maintain the hue and minimize color differences. Due to this, a compressed version of the image has been used for mapping purpose. The results are evident from the gamuts given below.
Source code | Mathematical background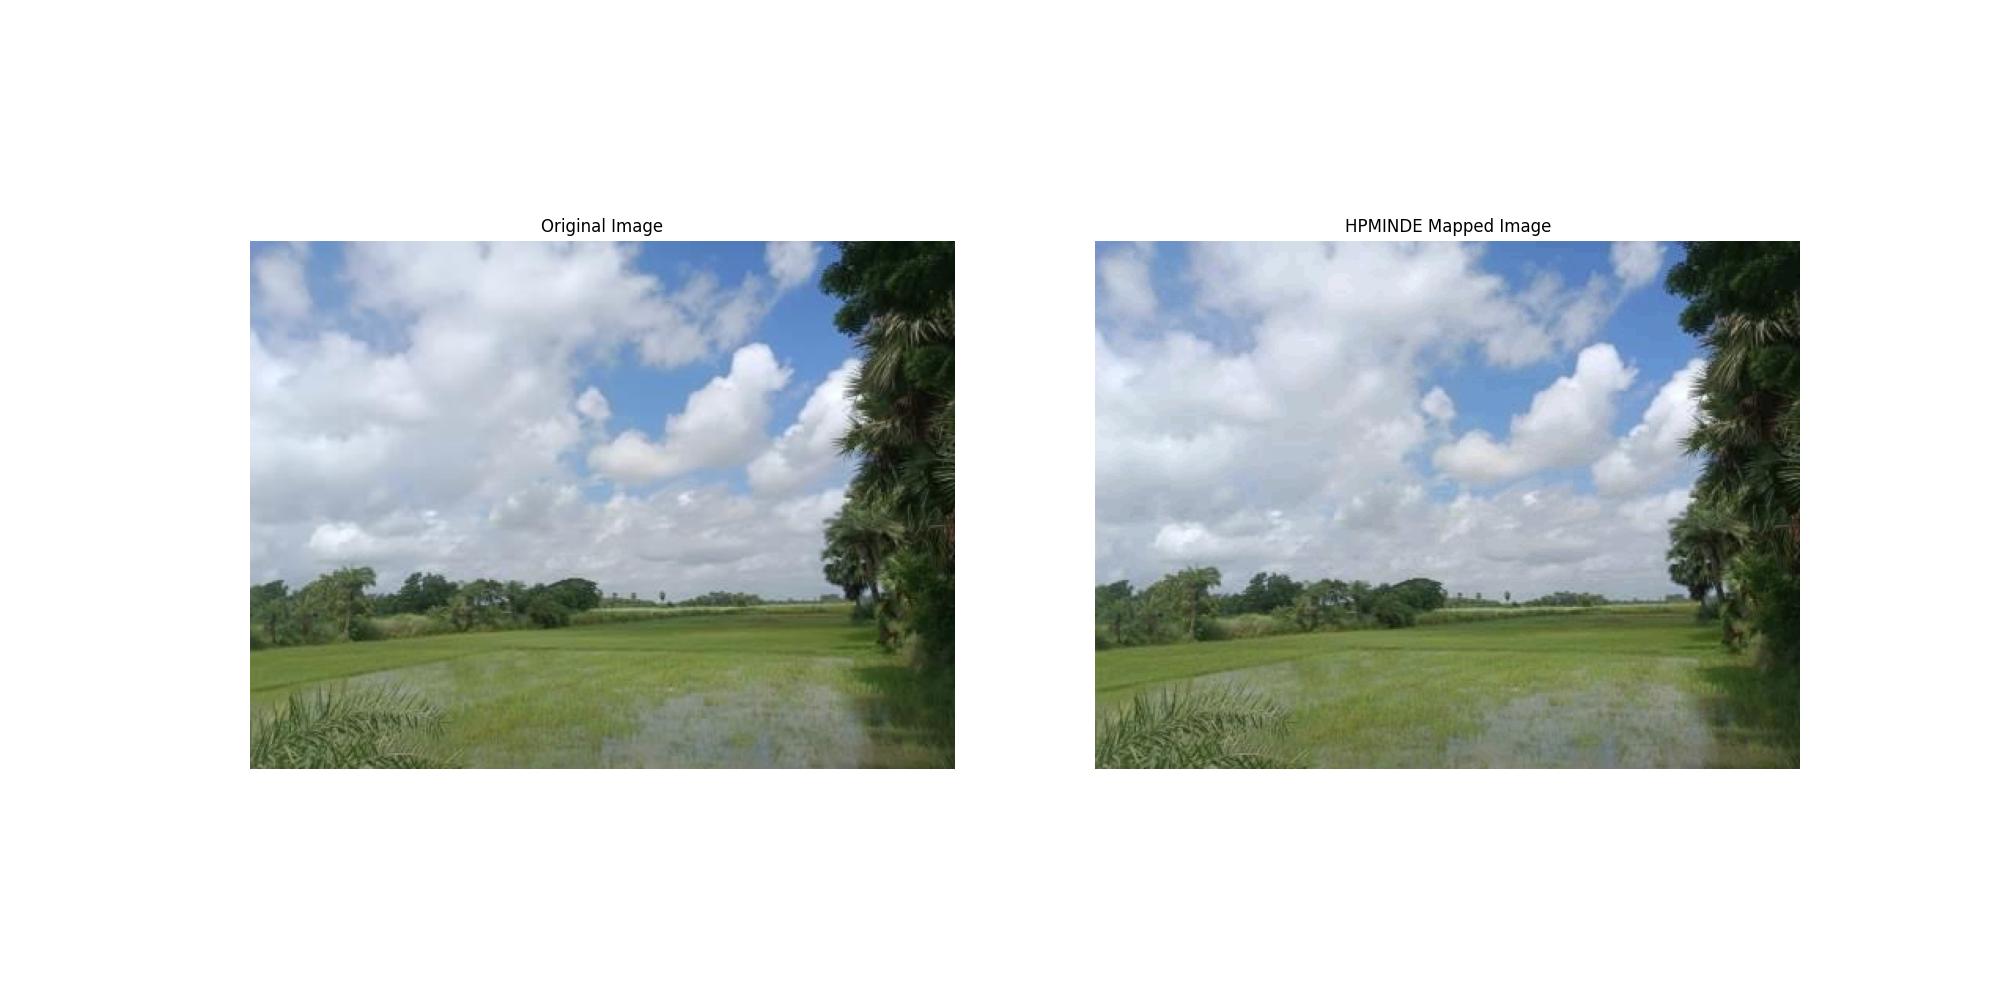
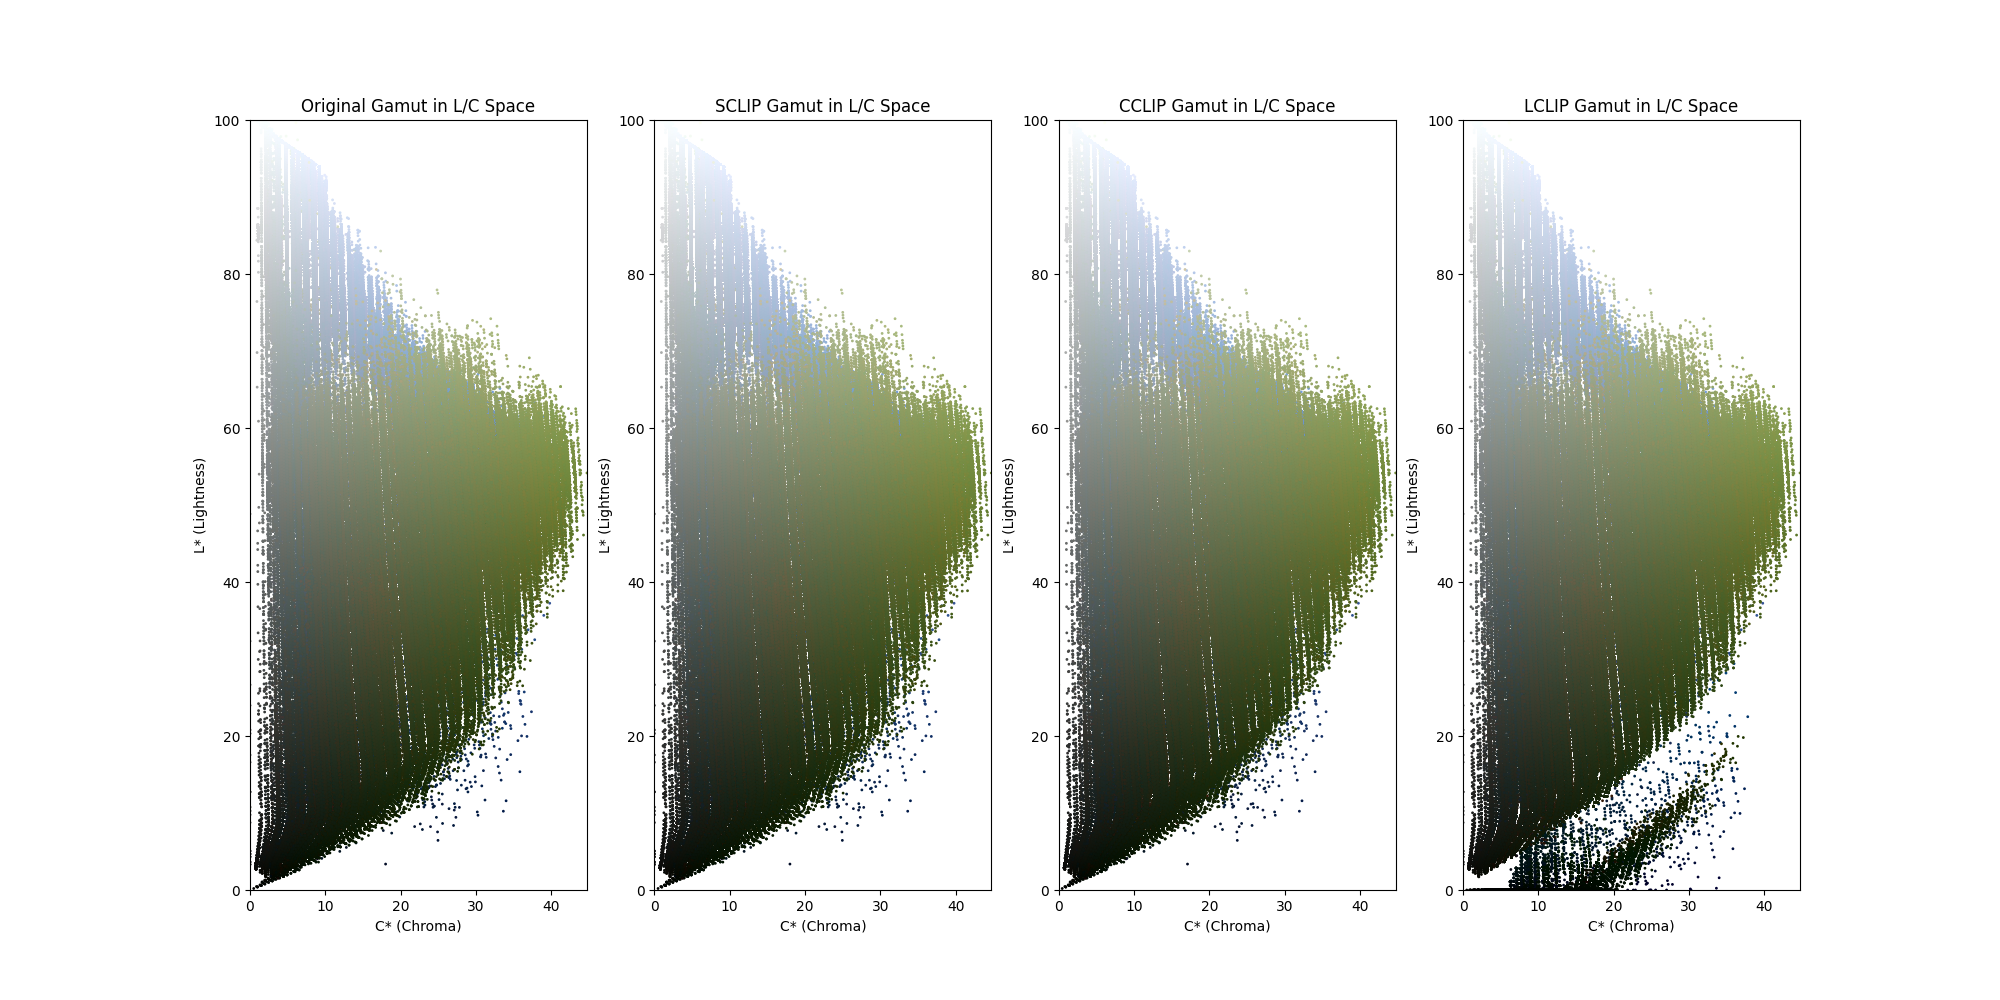
22.08.2024: Implementation of various gamut clipping algorithms
An implementation and analysis of three gamut clipping techniques: SCLIP (Spherical CLIP), CCLIP (Chroma CLIP), and LCLIP (Lightness CLIP) has been presented. Each method is designed to map out-of-gamut (OOG) colors into a target color space, specifically AdobeRGB, using different approaches to preserve certain aspects of the image's color quality. SCLIP preserves color balance by mapping colors towards a reference lightness, usually, which minimally alters color but maintains the overall look of the scene. CCLIP focuses on reducing chroma to bring colors within the target gamut, resulting in an image with lower saturation and more muted colors. LCLIP reduces the lightness of OOG colors, leading to darker tones and reduced brightness, particularly affecting the highlights and midtones.
Source code | Mathematical background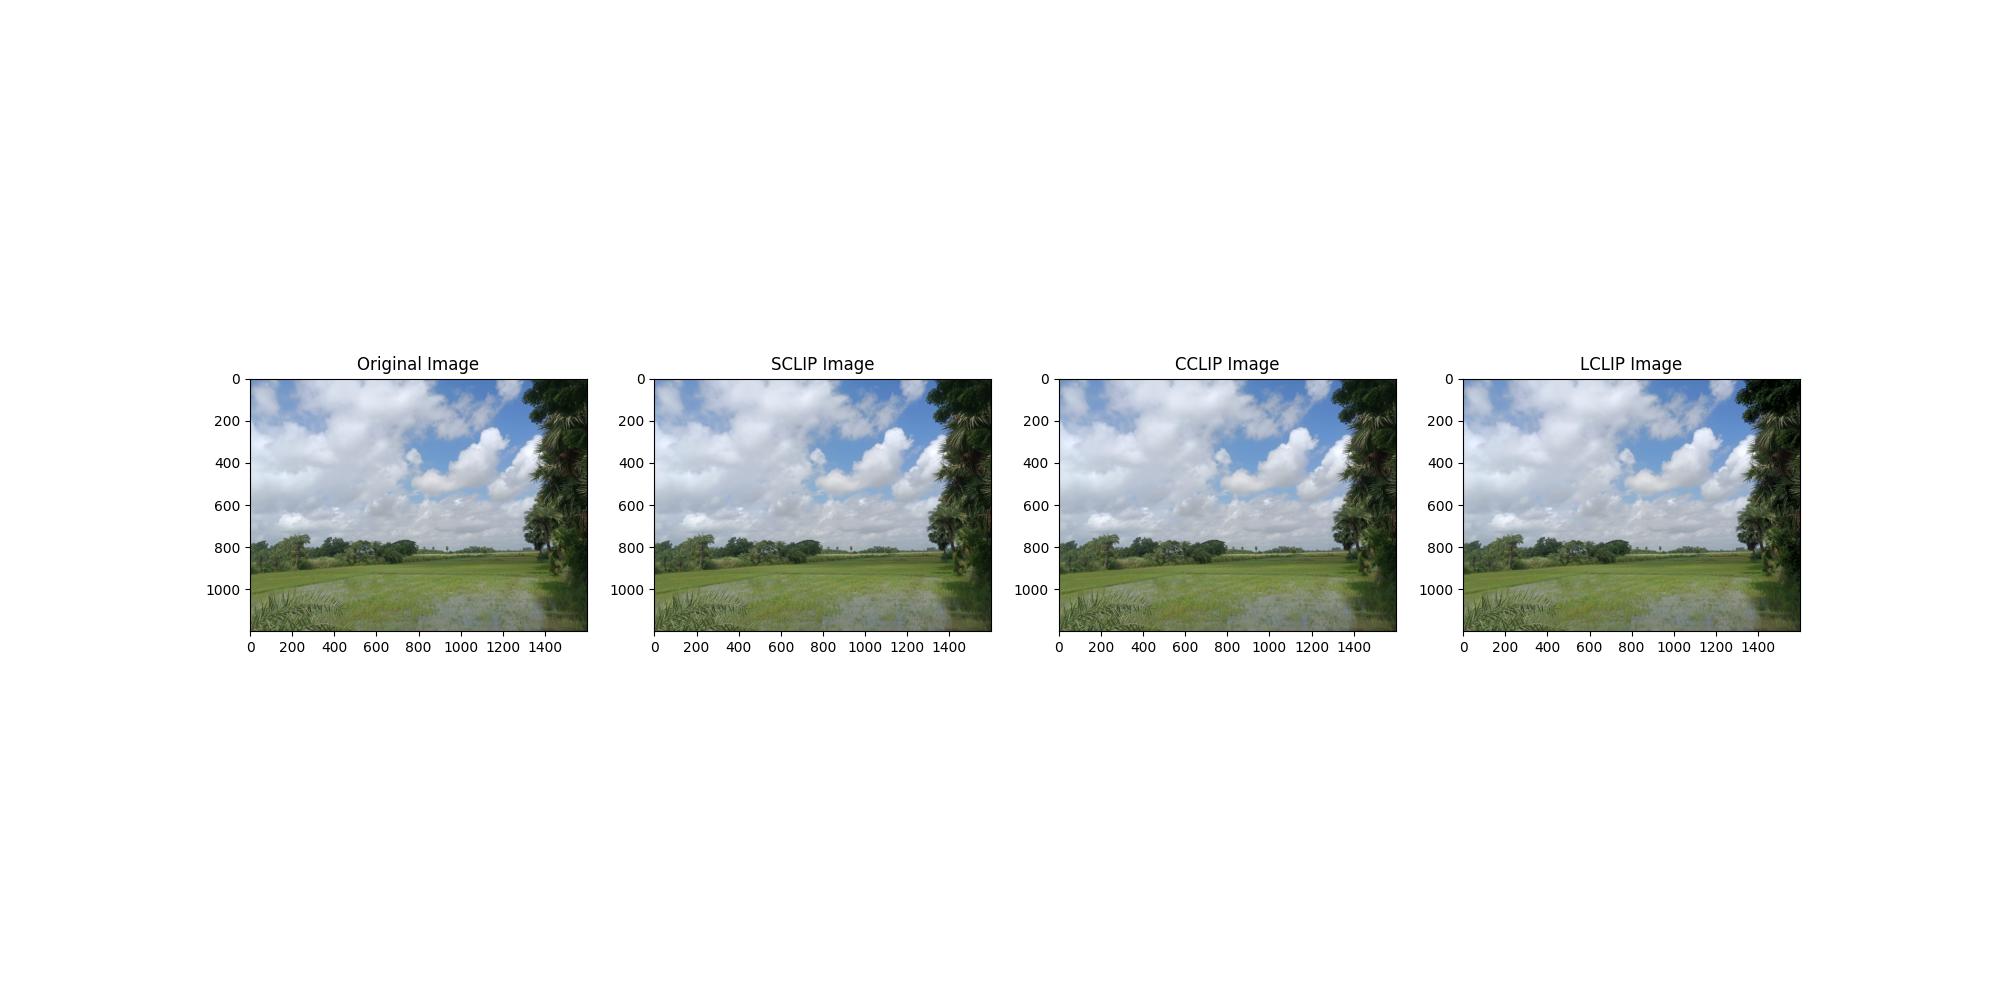
22.08.2024: Minimum Color Difference Gamut Clipping
An implementation of the Minimum Color Difference Gamut Clipping method, used for mapping colors from an input gamut (e.g., sRGB) to a target gamut (e.g., AdobeRGB) has been presented. A function is introduced that generates a representative sampling of the the AdobeRGB color space using the ICC profile. The resulting points is used to generate a Gamut Boundary Descriptor (GBD) for the AdobeRGB space. Out-of-gamut colors are mapped to the closest boundary point on the target gamut by minimizing the Euclidean distance in CIELAB space. Some shortcomings of the method include, reduced contrast, diminished colorfulness, and a loss of detail in the mapped images.
Source code for SMBGD | Mathematical background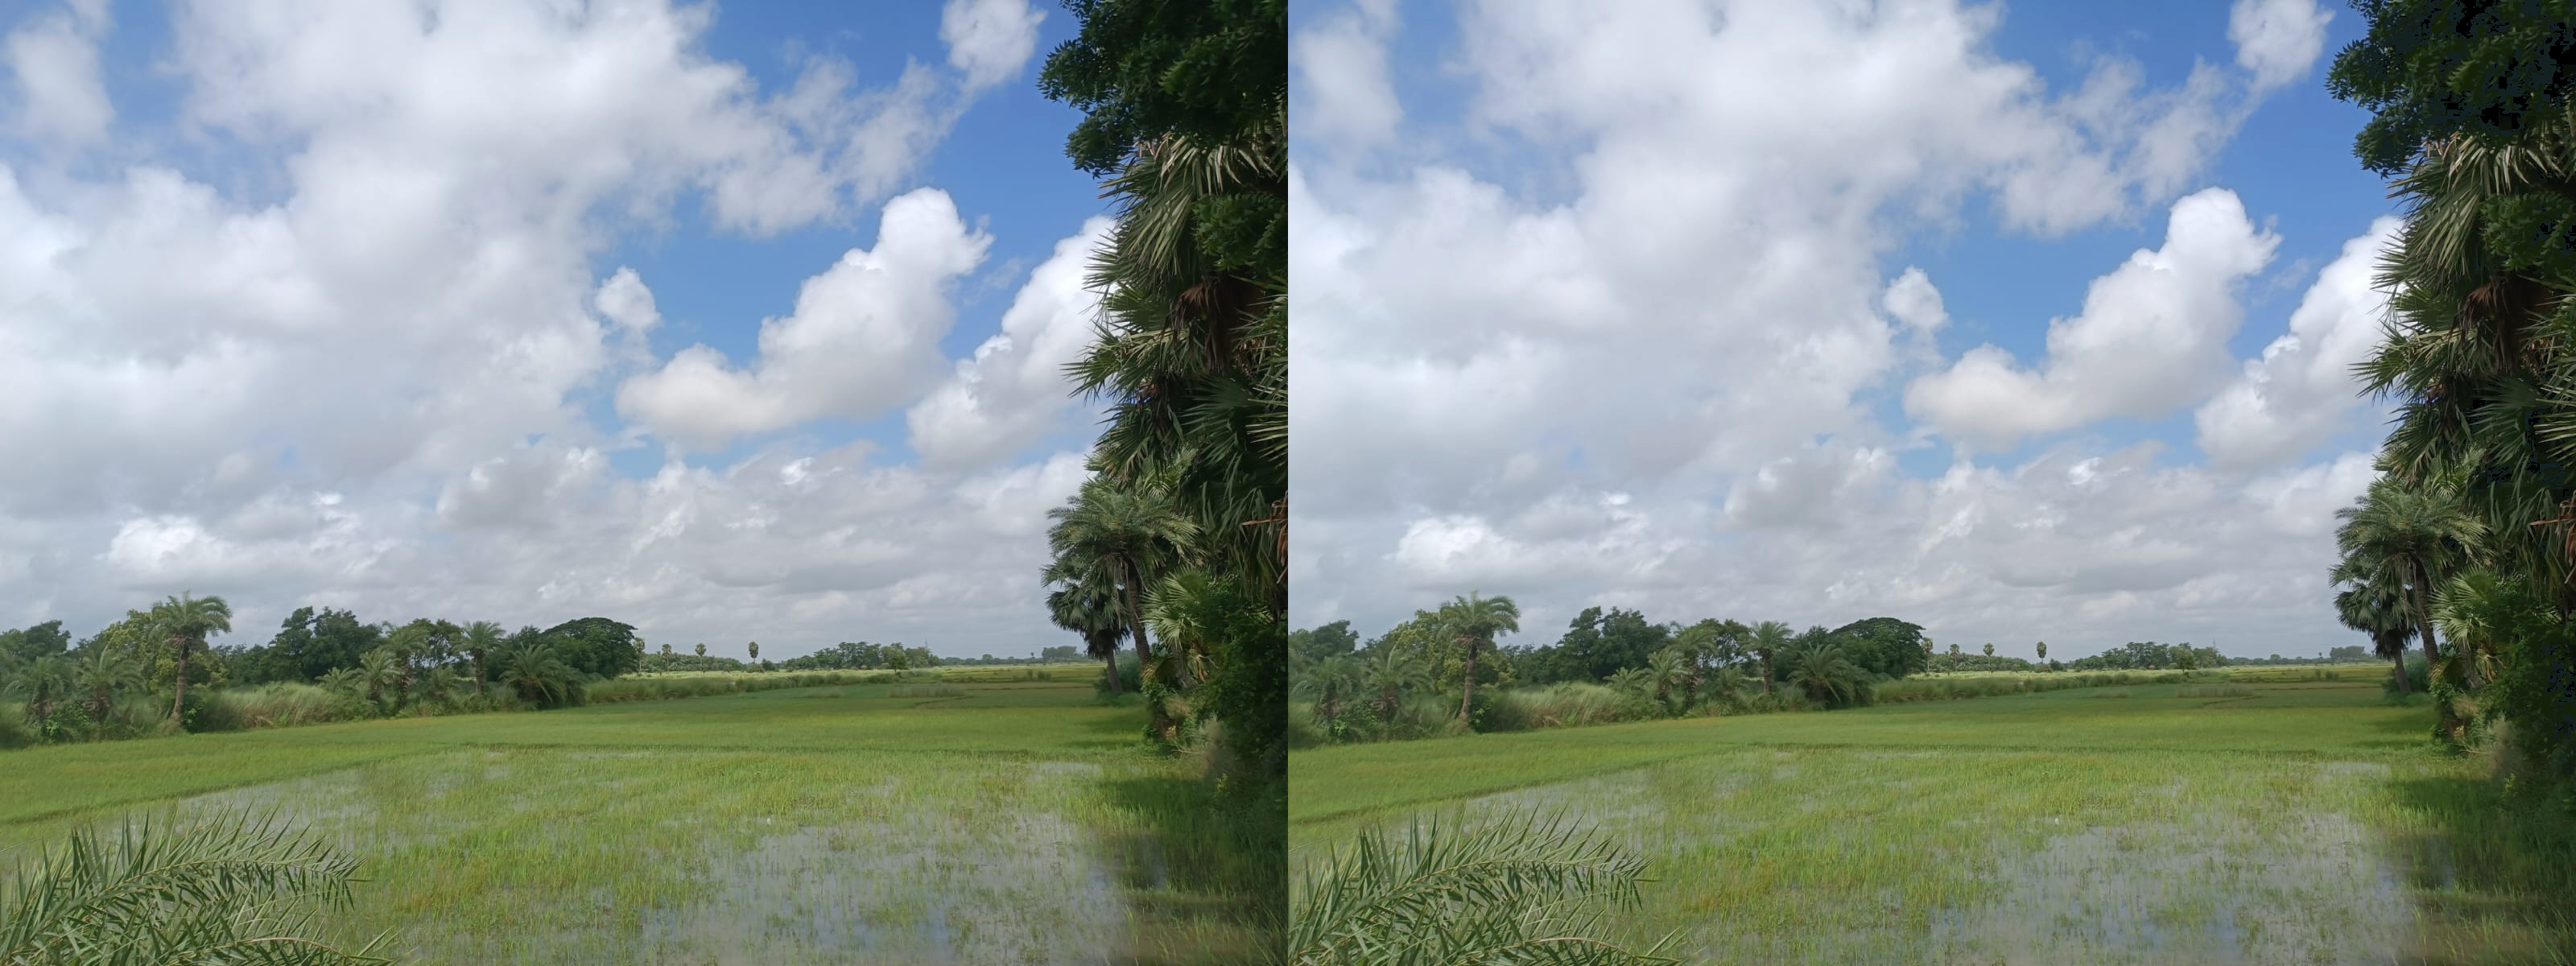
21.08.2024: Gamut Boundary Descriptor
A comparison has been drawn between the gamuts obtained from GBD calculated using convex hull method and segment maxima method. SMGBD results is more smoother gamut surface.
Source code for SMBGD | Source Code for convex hull GBD | Mathematical background
18.08.2024: Plotting FOGRA39 dataset in CIELAB space
Created this Python script that creates a 3D scatter plot to visualize LAB color space data from the FOGRA39 characterization dataset. The points are color-coded according to their RGB values and annotated with hover text displaying their LAB values. The script also draws black axis lines to help orient the viewer in the LAB color space.
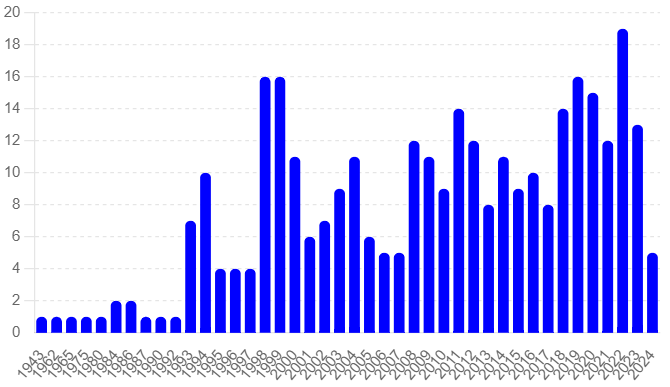
Plot | Source Code | More on FOGRA39 dataset20.06.2024: Review on use of computational intelligence in research on printing technology
A review on the application of computational intelligence (CI) techniques in the field of printing technology, highlighting how methods such as neural networks, fuzzy logic, evolutionary algorithms, and swarm intelligence have transformed various processes within this domain.
Interactive plot | Source Code.png)
17.01.2024: A simple image conversion pipeline
The color_conversion_pipeline repository offers a comprehensive Python-based solution for managing color conversions across various spaces. The workflow is structured into multiple steps, each handled by a distinct Python script, beginning with the extraction of RGB values and their conversion to CMYK.
Workflow | Source Code | Color equations used
25.09.2023: Plotting the gamut of an electrophotographic printer using uncoated media
Color patches varying in tonal values i.e., 25%, 50%, 75%, 100% for Cyan, Magenta, Yellow, Red, Green and Blue were printed on uncoated media containing OBA. They were measured using a spectroradiometer using D65 illuminant. Tristimulus values of color patches were obtained from their spectral data (considering CIE 1931 CMFs). The chromaticities were then plotted on the CIE 1931 chromaticity space (using the colour.plotting function from colour-science) and 3rd degree polynomial fitting was used to fit the data. The gamut boundary was obtained by joining the chromaticities of all colors having the highest saturation.
Source Code | colour.plotting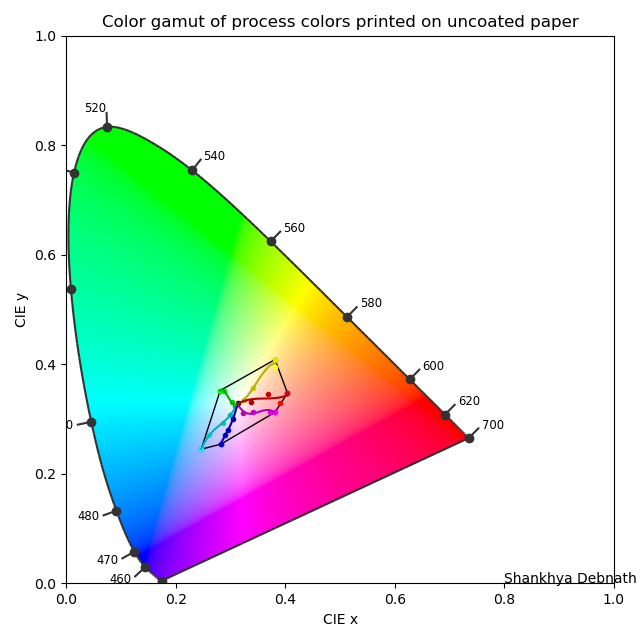
30.08.2023: Plotting on the CIE 1931 Chromaticity Diagram
The colour-science package for Python can be used to plot various colors on the CIE 1931 Chromaticity Diagram. The package provides a wide range of colorimetric functionalities including color algebra, plotting tools, etc. In this example, two colors having chromaticity coordinates have been plotted with respect to perfect white point and their dominant wavelengths have been calculated using the in-built function and that too have been plotted.
Source Code | colour.dominant_wavelength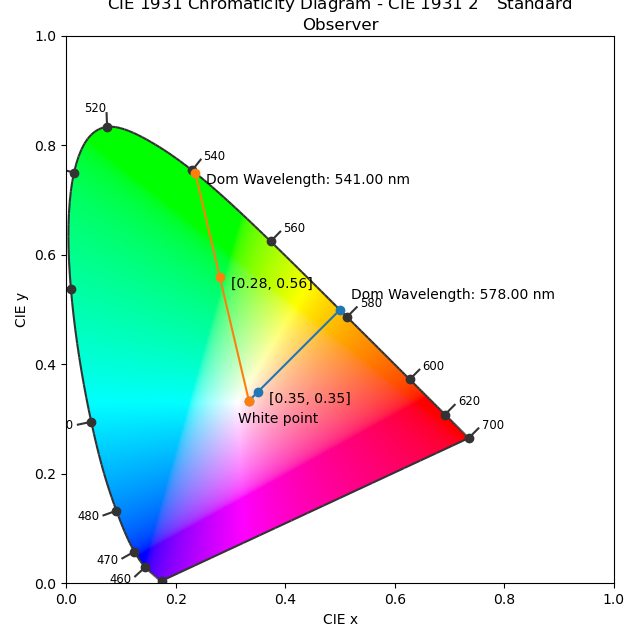
19.12.2020: A method for converting a scanner to colorimeter
A method is proposed here to use a standard scanner as a colorimeter by converting RGB values to XYZ values. This alternative approach is explored due to the unavailability of spectrophotometers, which are traditionally used for accurate color measurement. The method involves using a transformation matrix derived from data collected using a test target, with further accuracy improvements through polynomial color correction techniques. While this method is not a replacement for industry-grade equipment, it offers a cost-effective solution for educational purposes in practical color science.
Document20.10.2020: Developing a DIY spectrometer using OSS tools
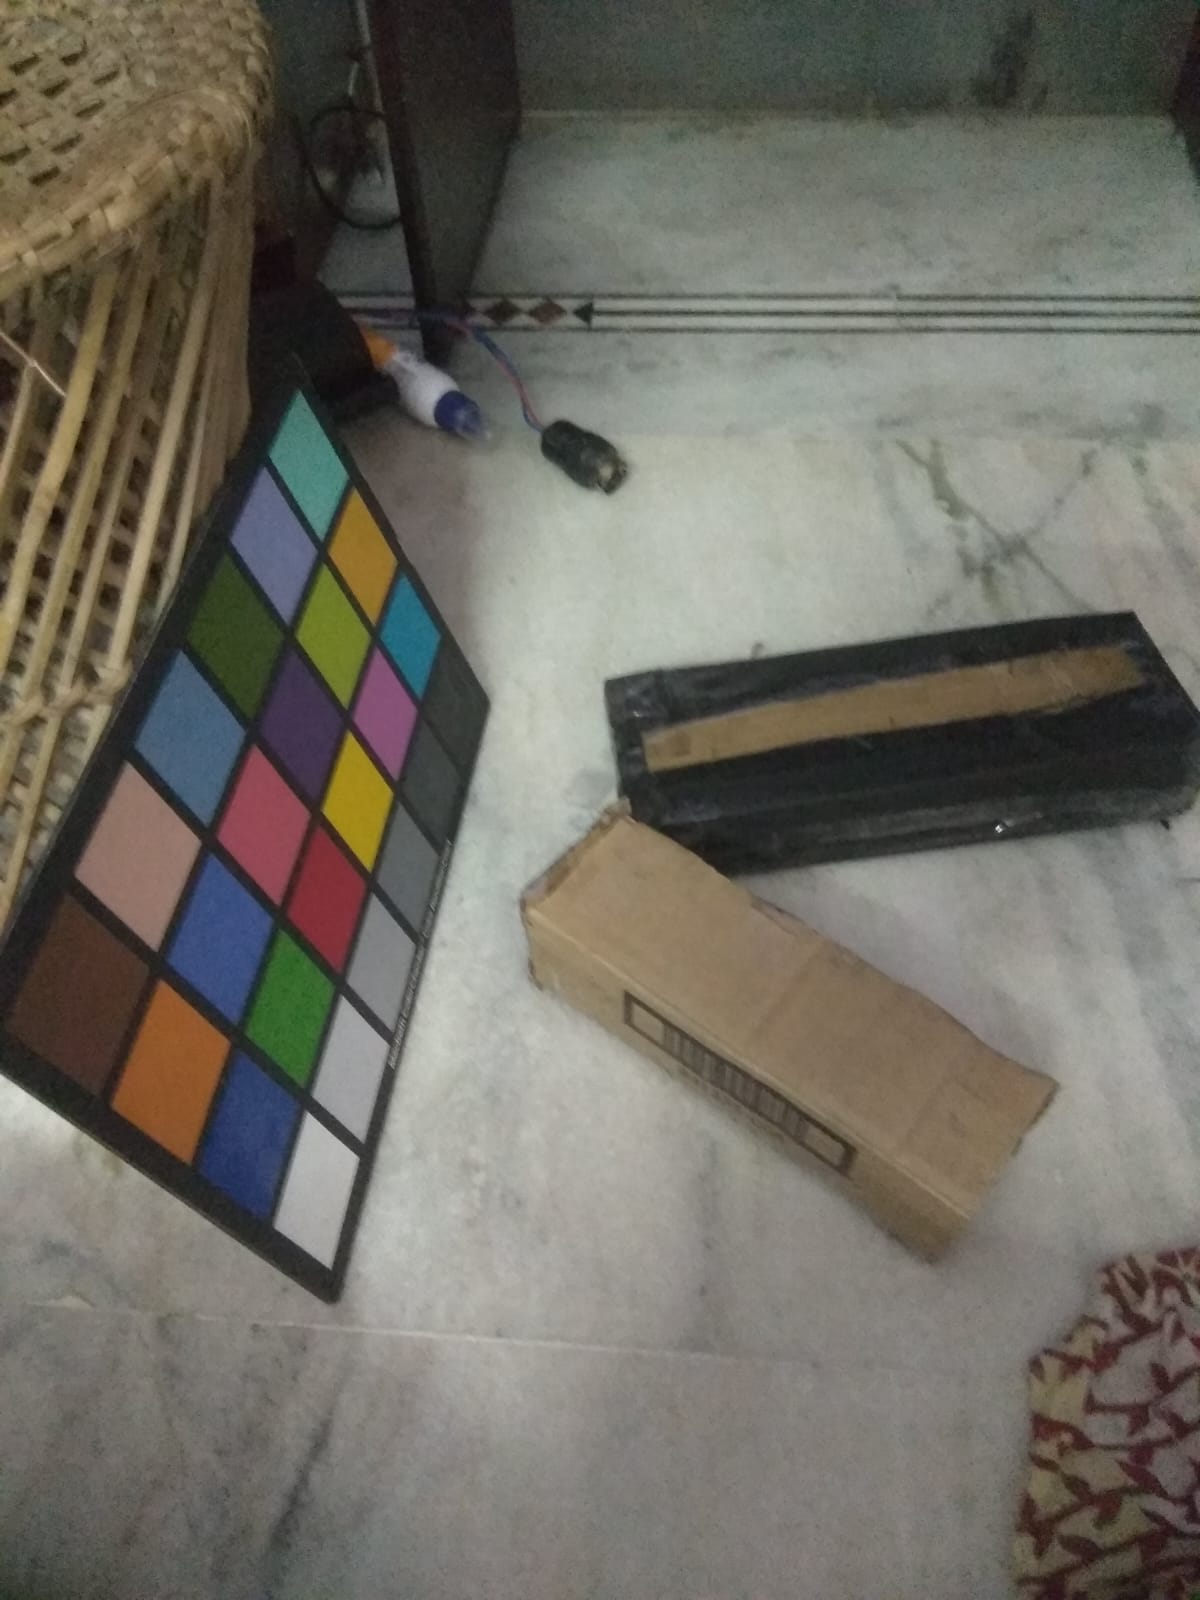
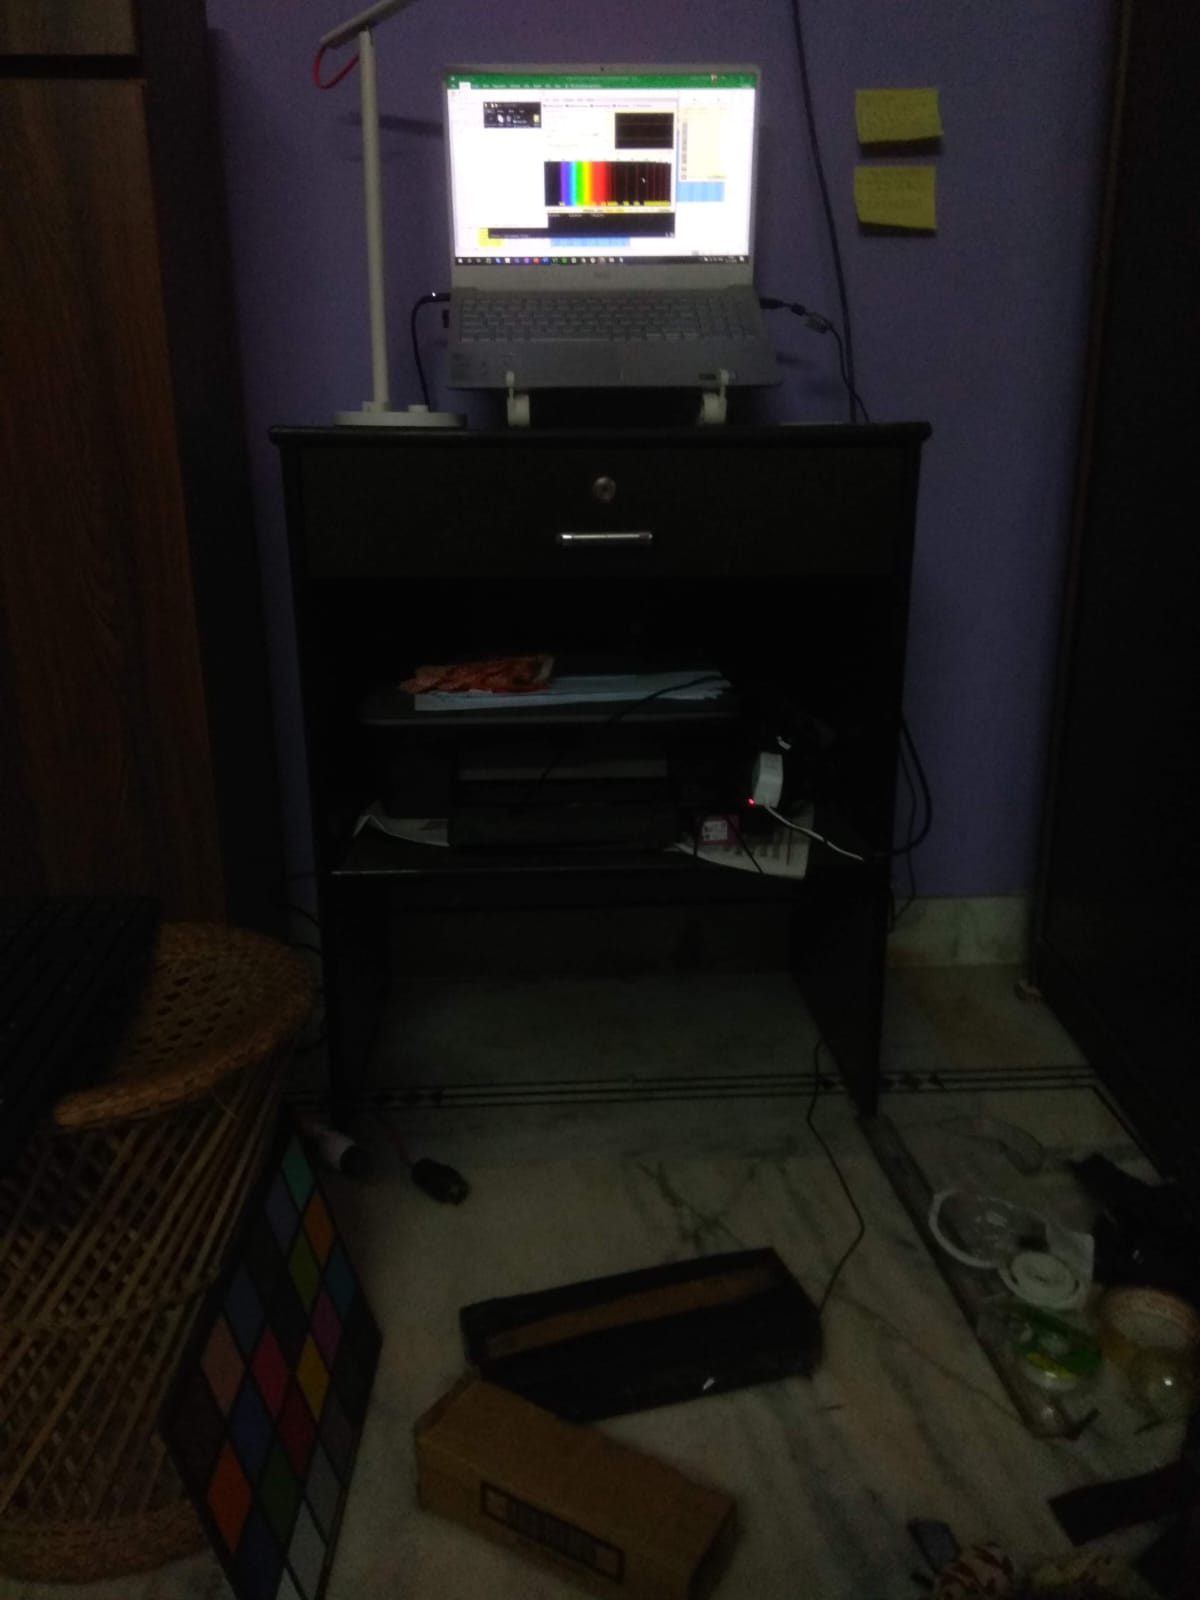
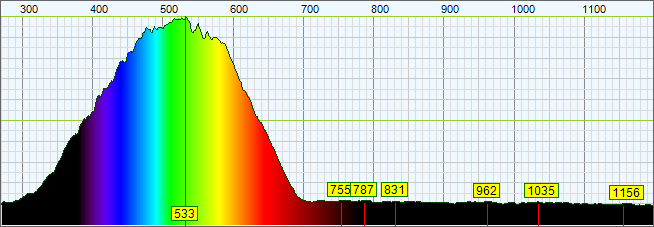
The project was initiated after attempts to procure a spectrophotometer and convert a desktop scanner into a colorimeter yielded limited success. Given my aim to develop color measurement and management tools using FOSS alternatives, and after quickly realizing the scanner can not really work as true spectrometer even if it characterized to behave as one due to a wide variety of reasons, I started reading on the possibility of developing a DIY spectrometer using OSS tools. I came across multiple sources Source 1, Source 2, Source 3, that helped me in ideating the process. I created a simple design with materials easily available at home and started developing the instrument. I got some valuable suggestions from a few good subject experts along the way. I used the Theremino Spectrometer software for obtaining the spectral data and plotting them. The DIY spectrometer is intended to capture Spectral Power Distributions (SPDs) of colorants using a tungsten filament light source, aiming to demonstrate color as measurable data and potentially use these measurements for printer characterization with ArgyllCMS. Given the limitations in resources and knowledge, I primarily sought to develop a proof-of-concept that can provide students with hands-on experience in color science.
The schematic of the instrument | Sources of information | Theremino Spectrometer | Raw spectral data of a sample measured by the spectrometer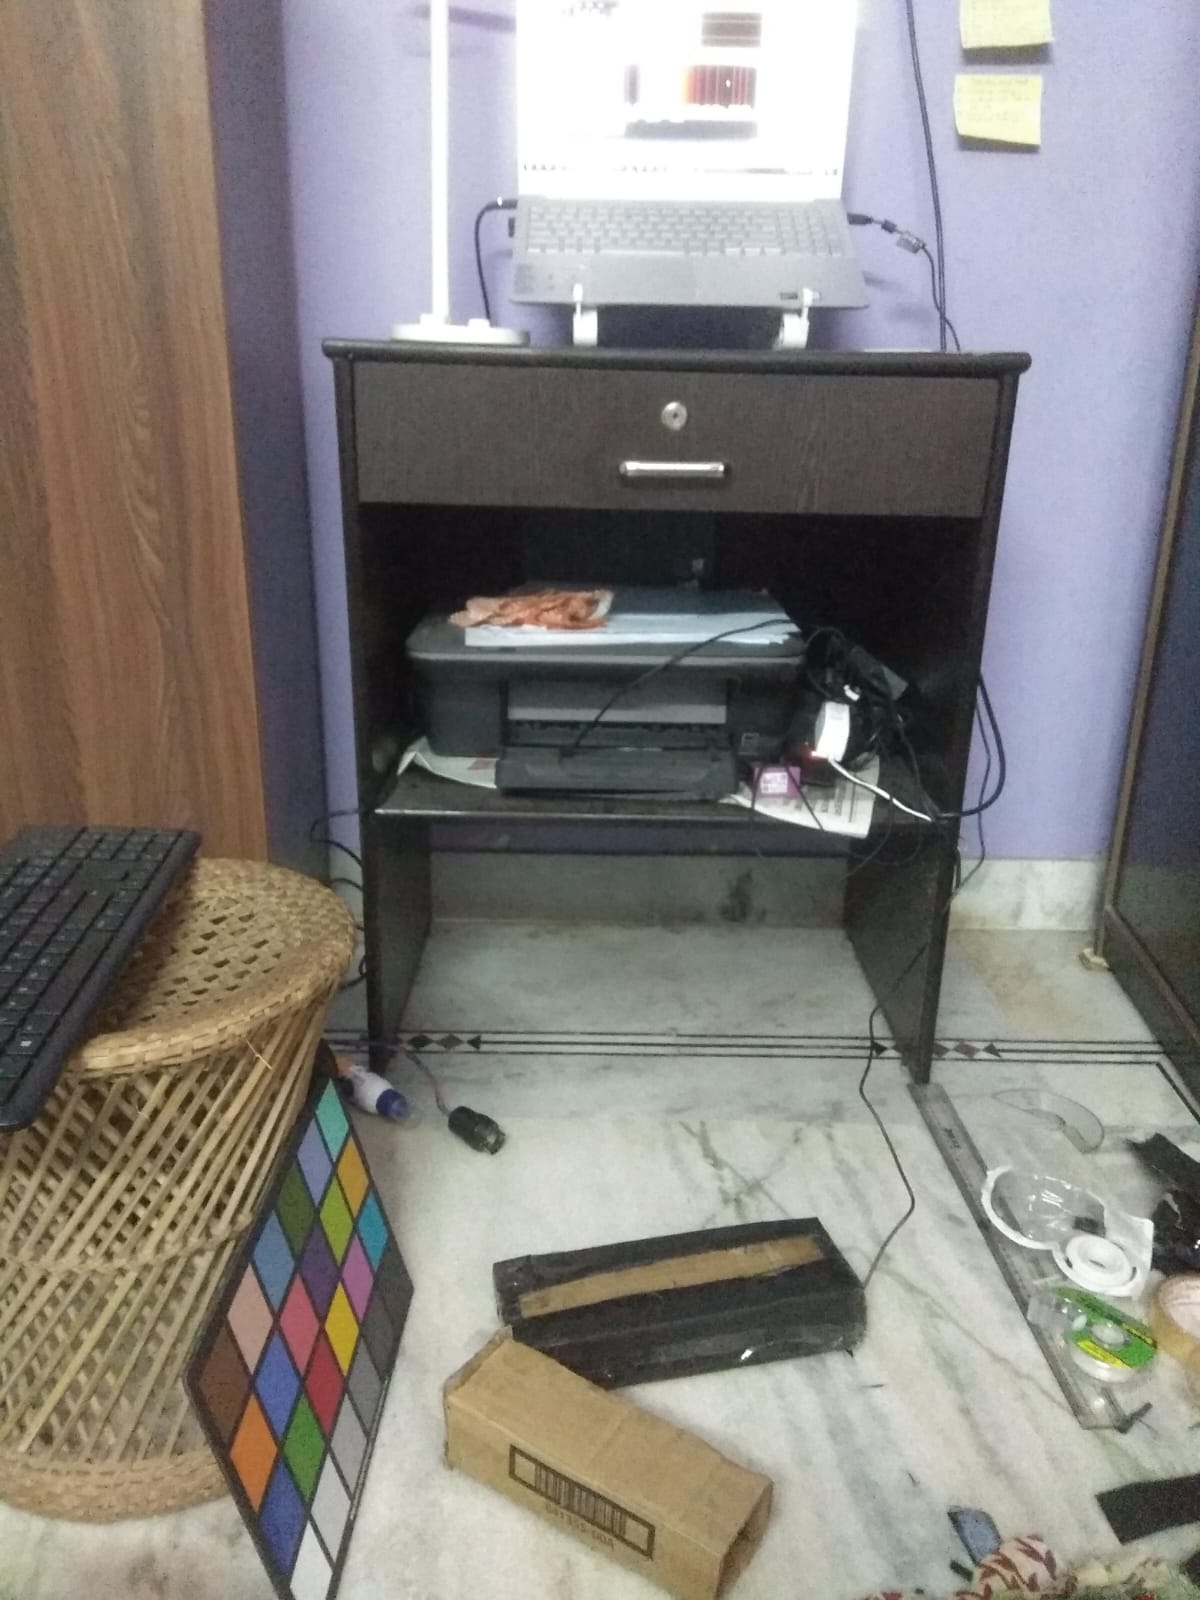
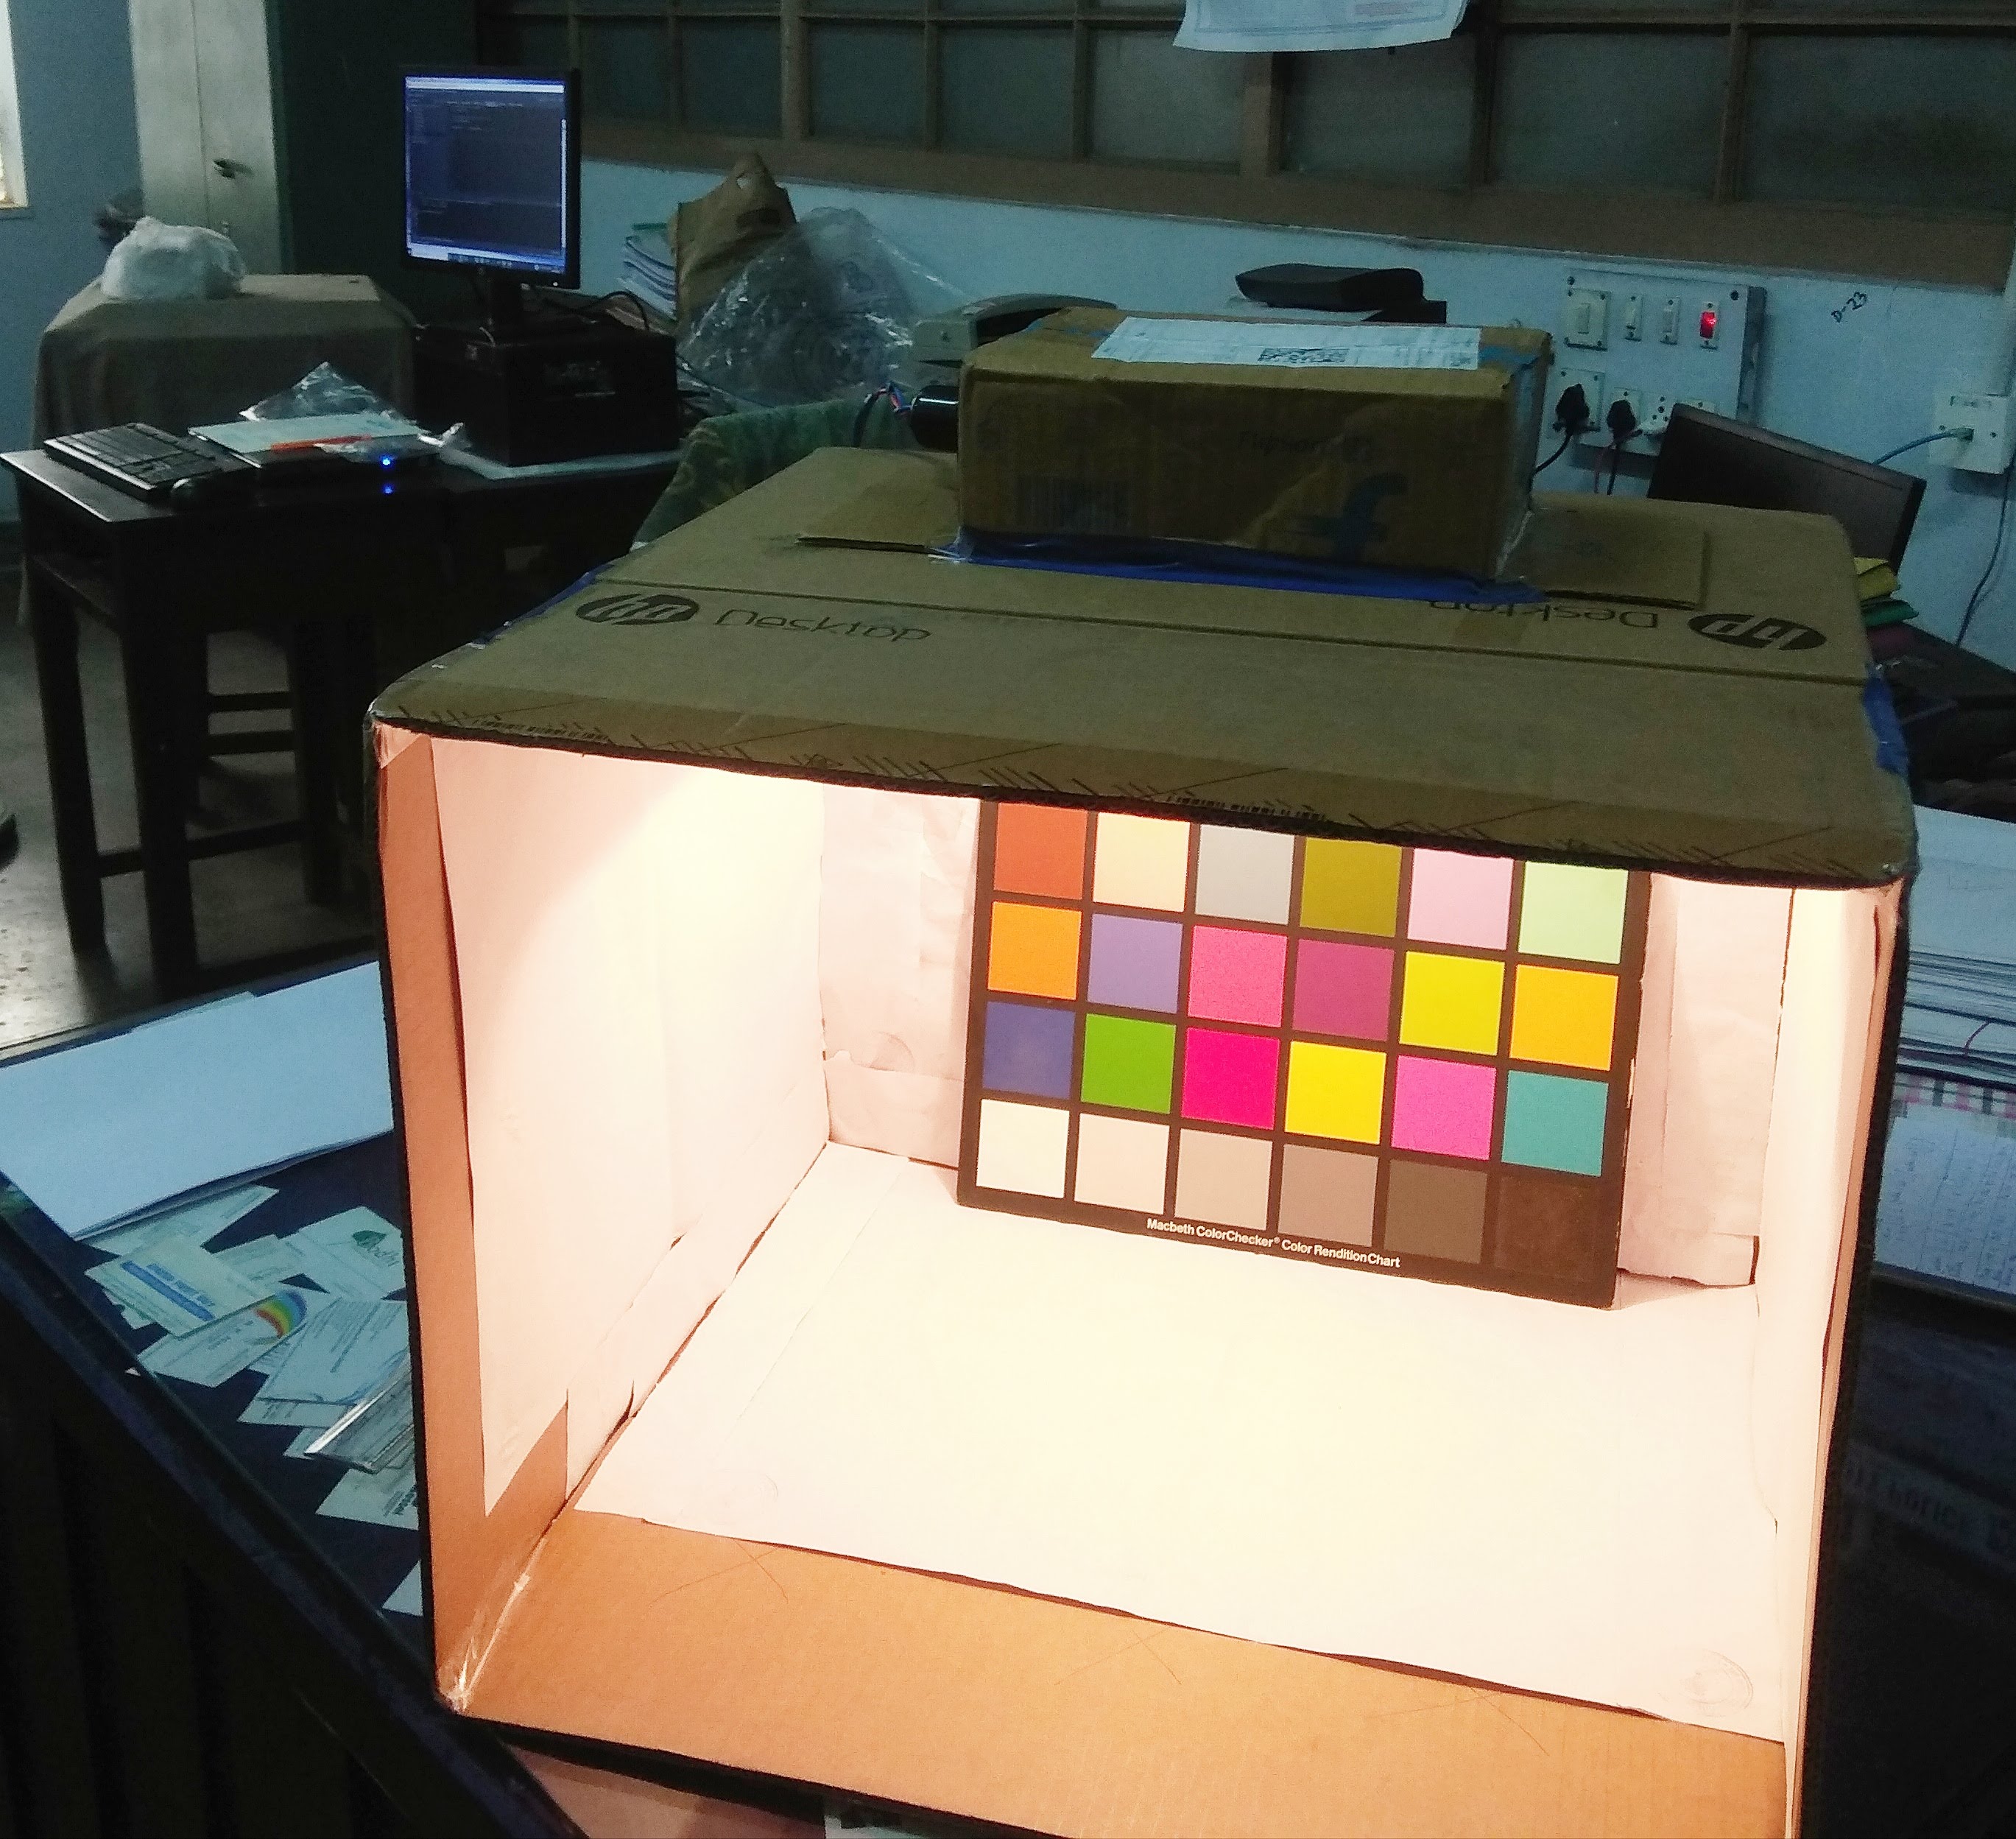
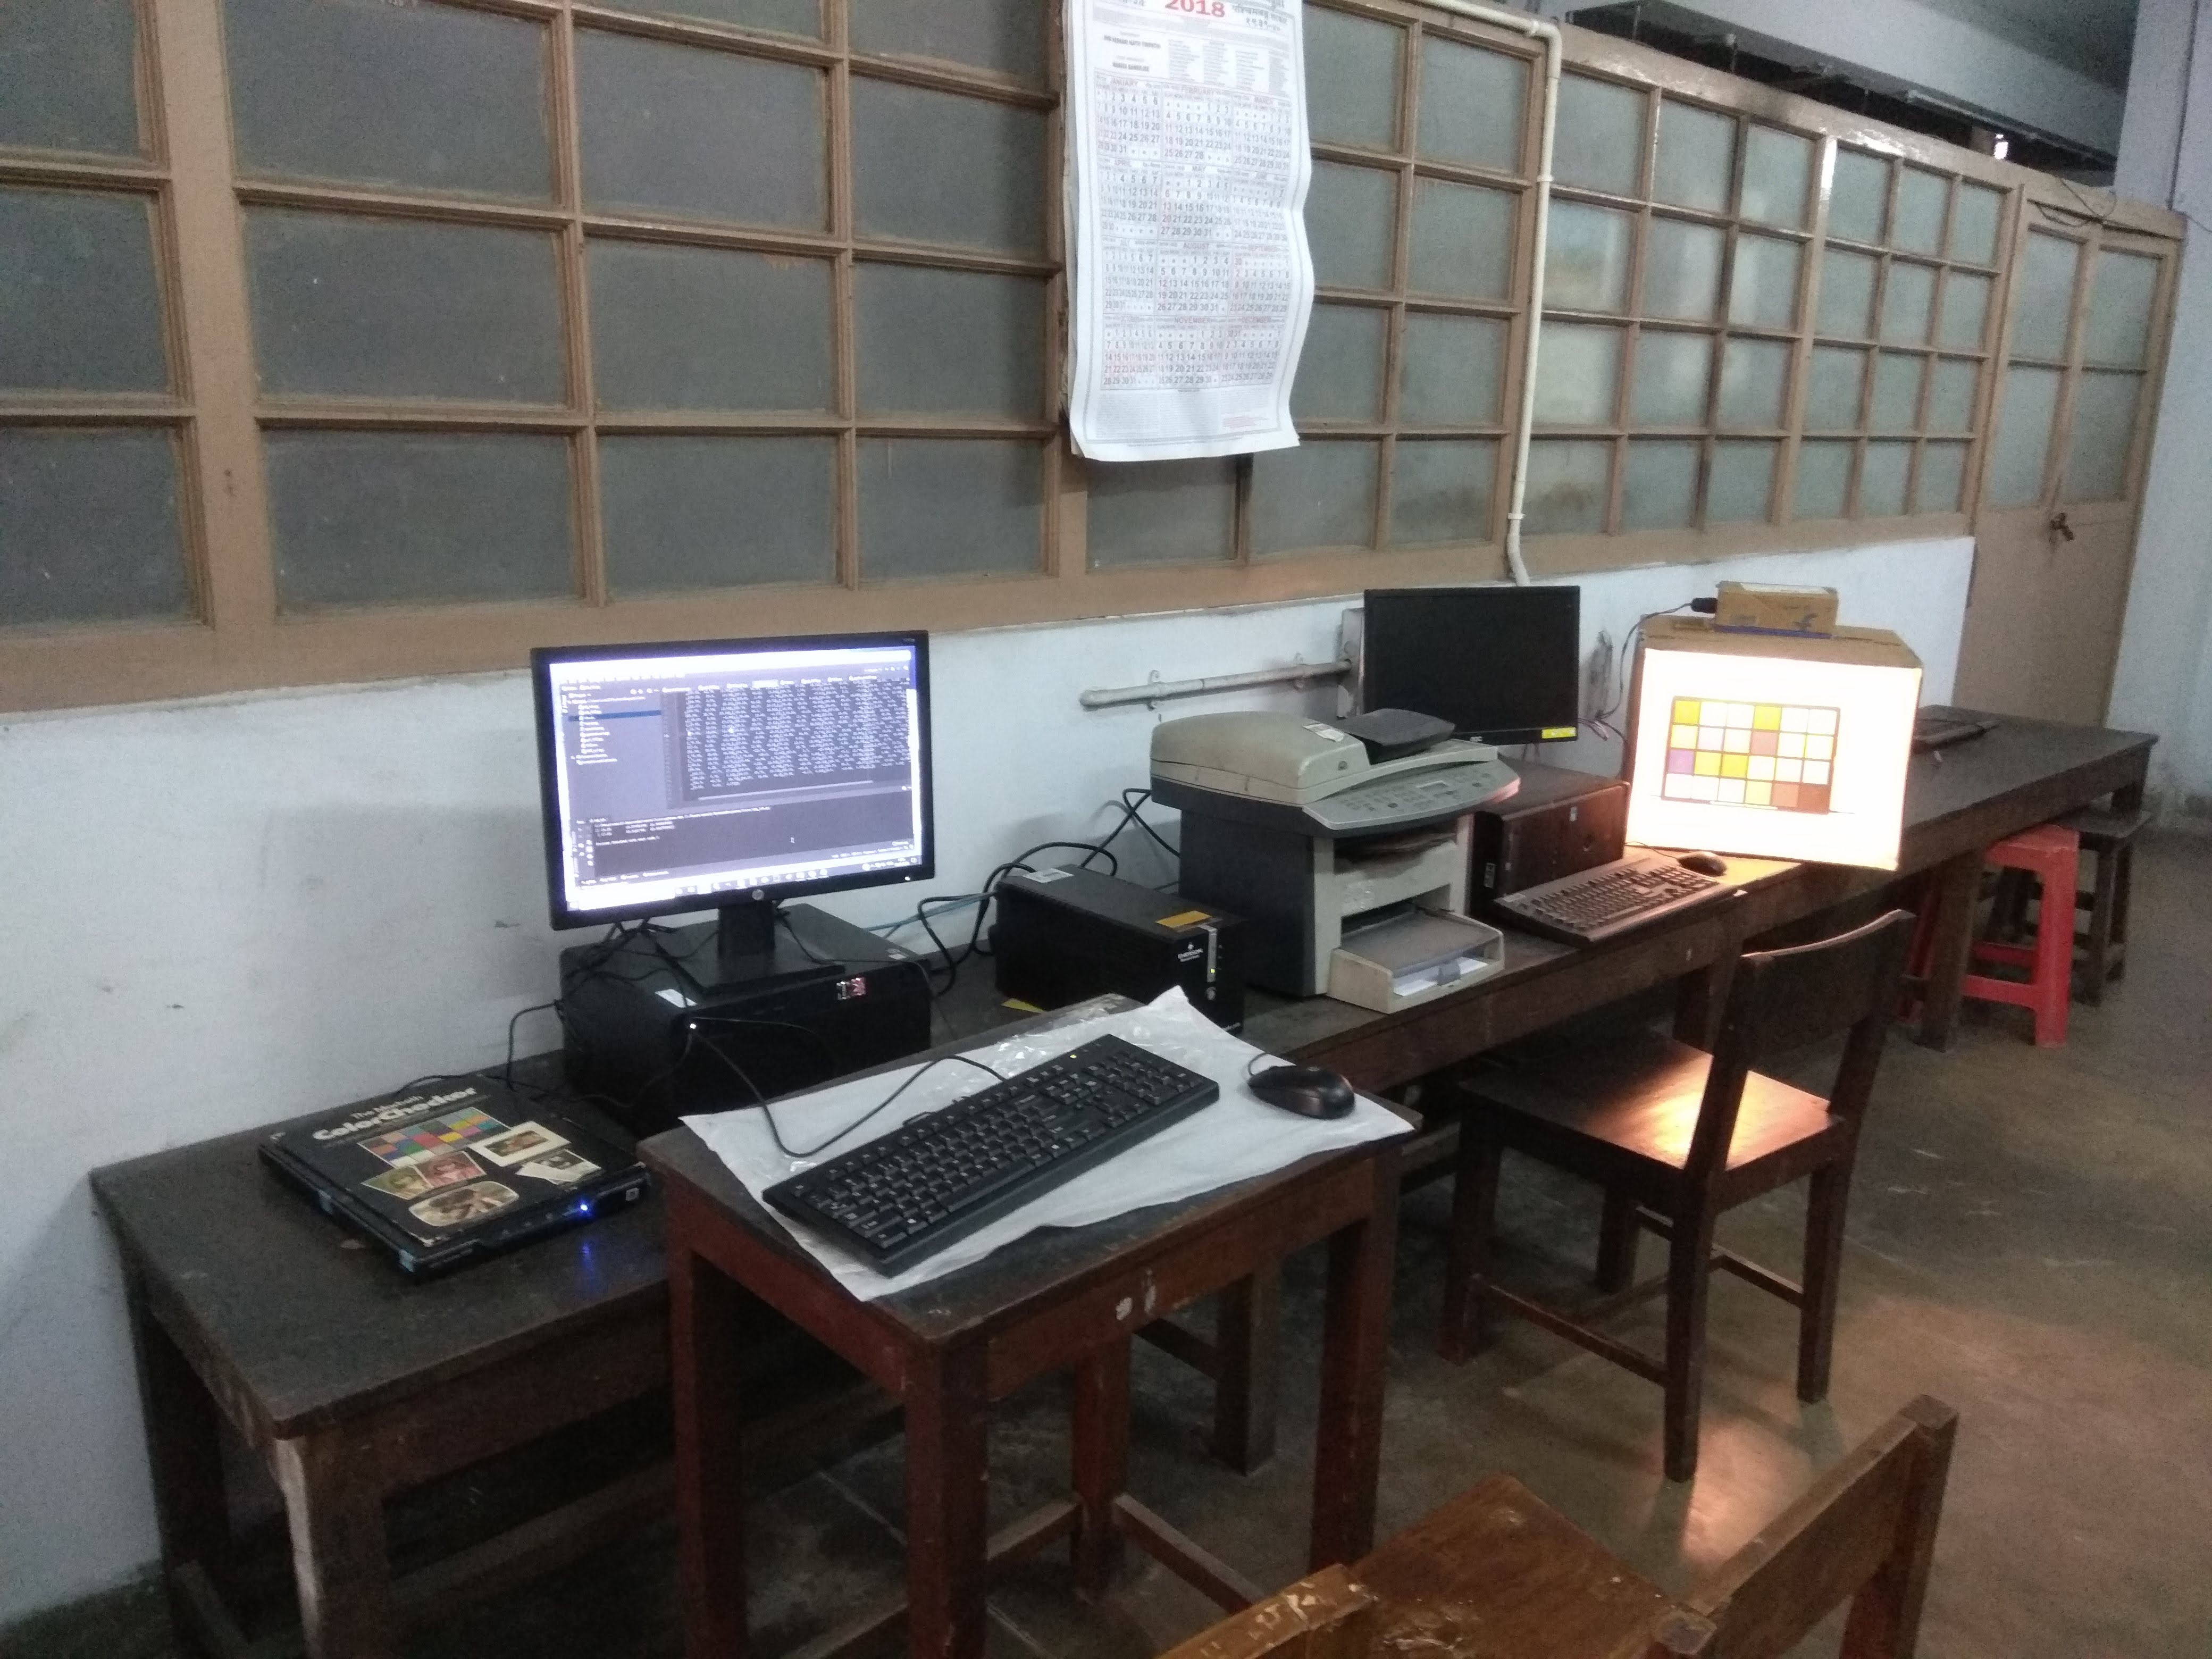
10.11.2019: Creating a color management laboratory using FOSS
In 2019, I started my journey on creating a complete color management laboratory without any proprietary hardware or software, but only using FOSS tools for the color technology laboratory course and other elective courses I teach at the institute. I document my initiative, the motivations, the hindrances and the solutions implemented in setting up of the lab. The lab was established using accessible open-source software, like ArgyllCMS and LittleCMS, in combination with basic hardware such as desktop printers and scanners. The document discusses the technical challenges faced, the solutions devised to overcome these challenges, and the significant learning curve involved in implementing these systems. It also reflects on the broader impact of the open-source movement on education and research, advocating for the use of free and open-source software to democratize access to advanced color management tools. The lab aims to provide students with practical experience in managing color workflows, ultimately enhancing their employability in the printing industry.
Read the journey here | ArgyllCMS | LProf